ETF Center
How TipRanks Determines the Analyst Forecast for ETFs
We all know how useful Wall Street analysts’ forecasts can be when we are forming stock-picking decisions. The same information could help you decide which Exchange-Traded Fund (ETF) best suits your investment goals. TipRanks is the first and only platform to provide analyst forecasts and price targets for individual ETFs.
TipRanks uses its proprietary technology to calculate the analyst forecast and price targets for ETFs based on a combination of the individual performances of the underlying assets. At a glance, you will see the overall analyst rating, analyst price target, and upside or downside on an ETF.
Innovatively, we calculate a weighted average number based on the combination of all the ETF’s holdings. For instance, the average price forecast for an ETF is calculated by multiplying each individual holding’s price target by its weight (allocation) in the ETF.
To navigate to the Analyst Forecasts page of an ETF, first, search for the ETF you are researching using the search bar, by entering either the name of the fund or its ticker symbol. By default, you will be brought to the ETF’s Analysis page. The Analyst Forecasts page appears on the menu on the left-hand panel.
Just as you study the analyst forecast for a stock on the TipRanks website, you can study the analysts’ forecast on ETFs. TipRanks makes it easy for you to check out the analysts’ consensus forecast before deciding whether to invest in an ETF and incorporate that data into your ETF research.
We can learn more about the ETF forecast page with the help of a popular ETF, the SPDR S&P 500 ETF Trust (SPY).
You will see four sets of information on the ETF’s forecast page. These include the Analyst Rating, the Analyst Price Target (for both All Analysts and only Top Analysts), and the list of stocks from the ETF with the Highest Upside and Lowest Downside Potential. Here is a guide to understanding each of those types of data:
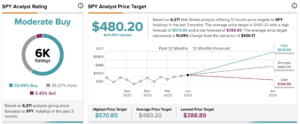
Analyst Rating – SPY is an equity-only ETF with 505 holdings in its portfolio (you can see this information on the ETF’s Holdings page). TipRanks accumulates analyst ratings of all the 505 holdings of SPY to derive a consensus rating, while also giving the breakdown of percentages of Buy, Sell, and Hold recommendations for all its holdings together.
As seen in the chart above, a total of 6,371 analysts have given ratings for all of SPY’s holdings combined, during the past three months. Out of this, 59.49% have given a Buy rating, 35.07% have given a Hold rating, and 5.45% have given SPY a Sell rating. This results in SPY receiving an overall Moderate Buy consensus rating on TipRanks.
Analyst Price Target – As seen in the chart, the average SPDR S&P 500 ETF Trust price target is $480.20. This price target is derived by calculating a weighted average number of all analyst price targets given to individual holdings in the ETF.
The closing price for SPY on June 27 2023, was $436.17. The average target price of $480.20 implies 10.09% upside potential from the last closing price. It is important to note that this upside or downside potential for the average price target will change daily, based on the closing price each day.
You can also see the highest price target and lowest price target for the ETF; those indicate the most bullish and most conservative price target recommendations for the portfolio. In the case of SPY, the highest price target of $570.85 implies 30.88% upside potential, while the lowest price target of $388.09 implies 10.84% downside potential from current levels.
Interestingly, you can also switch between viewing the overall analysts’ consensus and only the top analysts’ consensus for the ETFs. The Top Analysts are those with the highest success rates, best average returns earned, and the highest number of recommendations, according to TipRanks’ ranking system. Just above the consensus chart, you can see a taskbar that allows you to choose between the two and view the ratings accordingly.
Upside/Downside Potential – Surprised by what you read until now? Well, we have more. Along with giving ETF forecasts and price targets, TipRanks also gives a list of the stocks held by the ETF with the Highest Upside Potential and the Lowest Downside Potential. The list will also show you the Price & Change for one day, the Analyst Consensus on that stock, and the Analyst Price Target on the stock. This way, you also get a sneak peek into the top-performing and poorly performing stocks of the ETF’s holdings. You can also click on individual stocks in the list to further research them.
How to Use the Smart Score to Empower Your ETF Investing Strategy
Just as we calculate the TipRanks Smart Score for stocks using our proprietary technology, we calculate the Smart Score for ETFs. This revolutionary measure is based on the weighted average Smart Score of each holding in an ETF and some additional factors. Weights are derived based on the number of stocks having a particular Smart Score.
For example, the SPDR S&P 500 ETF Trust (SPY) has a Smart Score of 8, which is derived through a weighted average calculation. Among SPY’s holdings, 9.83% of stocks have a Smart Score of 10, 25.43% of stocks have a Smart Score of 9, and so on. We can see much of the information that’s included in the Smart Score on the ETF’s Holdings page, broken down into each individual stock’s parameters. Other data that are included in the Smart Score, such as News Sentiment, Hedge Fund trends, Crowd Wisdom (retail investors), and Technical Factors are calculated based on the actual ETF ticker’s parameters.
TipRanks calculates the Smart Score based on a combination of all these factors and derives a ranking from 1 to 10, with 10 being the best, called the “Perfect 10” Smart Score. A lower score, of between 1 and 3, indicates that the ETF will underperform market expectations, a score between 4 and 7 implies the ETF will perform in line with market expectations, and a score between 8 and 10 implies the ETF will outperform market expectations. Based on a study of an ETF’s Smart Score, you can decide to whether to invest in an ETF.
How to Use the ETF Center to Improve Your ETF Investing
Now, let’s see how the ETF Center helps you in optimizing your investments. To navigate to this page, go to ETFs – ETF Research Tools – ETF Center.
On this page, at the top, you will find the headlines of TipRanks’ latest news articles on ETFs, under the ETF News tab. Browse through the headlines and click on the link that you wish to read thoroughly. Or click on the More ETF News link to read more news articles.
Next, you have the option to surf to the ETF Screener and Compare ETFs tools curated by TipRanks. On the ETF Screener page, you will find a list of over 7,000 ETFs tracked by TipRanks. You can compare the ETFs on the Screener based on various parameters available on TipRanks. Meanwhile, on the Compare ETF page, you can compare up to 20 ETFs of your choice, based on a few pre-defined parameters.
As you scroll down further in the ETF Center, you will find a list of the ETFs on the Move, and the Top ETFs by Assets Under Management (AUM).
The ETFs on the Move feature displays the top 5 ETFs that have experienced the biggest price increases (Top Gainers) and decreases (Top Losers) in real-time, along with the 5 most actively traded ETFs (Most Active). This feature helps you identify potential ETF investment opportunities. At a glance, you will see the name and ticker symbol of the ETF, the Price & Change for one day, and the Volume of shares traded by the ETF.
The Top ETFs by AUM feature displays a list of ETFs ranked by the total value of assets they hold. AUM is a commonly used metric to evaluate the popularity and success of an ETF. The higher the AUM, the more money investors have put into that ETF. This feature can help you quickly identify the most popular ETFs in the market, allowing you to make informed investment decisions. At a glance, you will see the name and ticker symbol of the ETF, the Country focus of the ETF, and the AUM amount in billions of dollars.
And lastly, on the ETF Center page, you will see several lists of the top 5 players in their respective fields, under the Major ETFs by Categories tab. These categories include the S&P 500 Sector, Bonds, Commodities, Currencies, U.S. Industries, Country specific ETFs, Factor ETFs, Size and Value ETFs, Fixed-Income Factor ETFs, and more.
How to Use the Compare ETF Page to Improve Your ETF Investing
The TipRanks’ Compare ETF page aids you in comparing up to 20 ETFs of your choice based on a few pre-defined parameters. To navigate to this page, go to ETFs – ETF Research Tools – Compare ETFs.
Once you select the ETFs to compare, the data will be populated in table form. The list includes the following parameters under different tabs, as follows:
- Overview – includes the ETF Symbol, ETF Name, the Price & Change (%) for one day, the ETF’s Expense Ratio, price change for 1 Year (in %), the ETF’s AUM, the Smart Score, and the option to Follow the ETF.
- ETF Facts – provides information including the Index Name that the ETF tracks, Asset Class, Region focus, Category, Strategy employed, AUM, etc.
- TipRanks Essentials – includes TipRanks unique toolsets such as the ETF’s Analyst Price Target, Hedge Fund Signal, Insider Signal Strategy, News Sentiment, and the ETF’s Smart Score.
- Dividend – provides information on the ETF’s Ex-Dividend Date, Payment Date, Dividend Yield, Last Dividend Amount, and the total Dividend Amount in the last four quarters.
- Technicals – includes Average Volumes for different time frames, as well as a few Moving Averages.
- Performance – displays the percentage change in the price returns for varying periods ranging from 1 Day, 1 Month, 1 Year, Year-to-Date, and up to 5 Years.
That’s not all! The Compare ETF page also displays a Performance Comparison chart that displays a line graph for each selected ETF since May 2020. TipRanks considers May 2020 as the base (0.00%) for this comparison and shows how much an ETF has gained/lost (% terms) as of a particular date, since the base date. You can hover over the line graphs on different dates to see the comparative performance of each ETF. By studying this chart, you can easily see how the ETFs have fared historically in terms of their prices and find out which one has offered the best returns.
Additionally, you can customize and select other data points that you wish to see on a dropdown list under the Select Columns tab on top of the table. The Compare ETF page can assist you in thoroughly comparing ETFs and deciding on the best one to invest in.