Earnings
How to Use TipRanks’ Earnings History Tables in Your Investment Strategy
A stock’s earnings (EPS or earnings per share) results play a very important role in the stock’s performance. Wall Street analysts build in-depth financial models for companies and project revenue and earnings for said companies, quarterly. Each time a company reports its quarterly results, they are compared with the analyst expectations, and the stock price usually fluctuates in tandem. Consistent earnings beats vis-à-vis the analysts’ estimates tend to push the stock upwards, while earnings misses pressurize the stock down.
To understand how the company has performed historically regarding its earnings, TipRanks has built a dedicated Earnings page. To navigate to the page, go to the stock page that you are studying. On the left panel bar, go to Earnings. On the top, you will see the Earnings Data table, which shows you the next quarterly earnings Report Date, the Period Ending for the quarter, the analysts’ Consensus EPS Forecast for the quarter, Last Year’s EPS figure for comparison, and the TipRanks Analyst Consensus (Buy/Hold/Sell) for the same.
Below the table, you will find the stock’s Earnings, Revenues Date & History Chart. On this bar chart, there are two main tabs: Earnings and Revenues. On the Earnings tab, you will find the historical Estimated EPS (colored dark green) figures vis-à-vis the Reported EPS (colored light green) figures. The table gives you the actual data for the last eight quarters already reported, and the EPS estimates for the upcoming quarter. Please note, the upcoming earnings date is often based on the dates of a company’s previous reporting and may be updated when the actual date is announced. The bar chart makes it easy to understand how many times the stock has outpaced or missed its earnings expectations in the past quarters.
On the Revenues tab, you will see a chart presenting the actual revenue (colored dark green) and earnings (colored light green) performance for the past nine quarters. By looking at the trend in both metrics, you can learn whether the company has improved or worsened its performance over time.
Next comes the stock’s Earnings History table. This again gives you the same earnings Beat (green color) or Missed (red color) data in a tabular format. The table shows the quarterly Report Date, Fiscal Quarter for the report, Forecast/Actual EPS figures, Last Year’s EPS figure for better comparison, EPS YOY Change (in both % and actual terms), and a link to the Press Release of the earnings. This table displays the historical data for the past nine quarters plus the estimated data for the upcoming quarter. You can click on Show More to see historical data up to 2018 (wherever available).
By studying all these data sets, you can dive deeper into the reasons why the company may have missed estimates earlier and what the company is doing to improve future performance. This study will help you to make an appropriate buy/hold/sell decision on the stock.
Let’s understand the importance of studying the Earnings page with the help of an example:
During the COVID-19 pandemic, most technology stocks reported significantly improved earnings and revenue numbers due to increased use of technology, which pushed the stock prices higher. However, as the pandemic faded, the demand for tech-related products diminished, pressurizing companies to engage in higher layoffs and cost-cutting measures, which effectively dragged down their share prices. If you compare the earnings and revenue trends for these stocks in the past and current quarters, you will see a decline. That implies that the stocks had to undertake massive hits to bottom lines and sales expectations. Analysts across the sector have revised their earnings expectations on tech stocks to keep in line with the subdued demand. Such an in-depth study of a stock’s earnings and revenue trends can assist you in making an apt investment decision.
How to Use TipRanks’ “Earnings-Related Price Changes” Tables in Your Investment Strategy
Now that you are aware of the importance of a stock’s earnings beat or miss, next up is understanding how that impacts the stock’s price. TipRanks helps by consolidating the data of the price movement of the stock both before and after the earnings release to see how it impacts the stock.
On the Earnings page of stock, you will find the Earnings-Related Price Changes table at the bottom of the page. This table displays the earnings Report Date, the stock’s Closing Price Before the Earnings, the stock’s Price After the Earnings, and the Percentage Change between the two prices. The table shows historical data from up to 2020 (wherever available). By studying this data, you can gauge how much a stock’s price has moved immediately after an earnings beat/miss, and this information can help you to make appropriate trading calls during the earnings season. Many investors view the earnings seasons as a suitable time to buy or sell stocks, and the TipRanks Earnings Related Price Changes table can be extremely helpful in making these decisions.
Let’s understand this table with the help of an example. Below is a screenshot of tech giant Microsoft’s (NASDAQ:MSFT) Earnings-Related Price Changes table.
Please note: If earnings are announced before the market opens on a particular day, we show the initial closing price of the day before and the closing price of the day the results are announced. Meanwhile, if earnings are announced after the market close on a particular day, we show the closing price of the same day as that of the earnings date, and then the closing price of the following day.
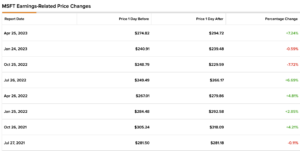
MSFT posted its earnings results on April 25, 2023 (after the market close). The closing price of MSFT on the day of the earnings release, April 25, was $274.82. The closing price after the earnings beat rose to $294.72 on April 26. The percentage change between the price on April 25 and April 26 is 7.24%. Many investors would thus choose to follow an investment strategy based on this historical figure: the opportunity to earn a similar short-term price appreciation on the stock. Reviewing a stock’s historical price changes immediately after earnings can help investors shape their investment strategies. On this chart, you can see the % price changes for the other earnings dates as well.
It is important to note that the price changes, post-earnings, do not fully depend only on the earnings beat. The revenue beat is also important and so is the outlook that the management provides in the earnings release. Plus, any kind of other information like dividends or share buybacks can affect a share price. Based on your study of the stock’s past price performance related to earnings, you can decide how to make trading calls during the earnings season.