Technical Analysis
How to Use the Technical Analysis Tool to Assess a Stock’s Price Movement
Have you decided which stock you want to buy after thoroughly understanding its financials and valuations? Well, that is just one part of the game. The second part involves the timing of the stock purchase: When is the right time to buy the stock?
One way of determining the timing of the stock purchase is to study the technical indicators of a stock. To address the issue, TipRanks’ recently launched the All-In-One Technical Analysis tool, which offers a variety of technical indicators to help you make better-informed investment decisions. To navigate to the new Technical Analysis page, simply go to any stock page you wish to study, and you will see it in the menu on the left side of the page.
Technical Analysis is a method of evaluating securities by analyzing statistics generated by market activity, such as the stock’s past prices and volume momentum. This type of analysis is often used by traders and investors to identify trends, predict stock movement, and make informed investment decisions.
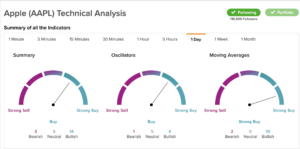
Once you have landed on the Technical Analysis page, you will see a Summary of All Indicators along with a chart. The default reading of the technical indicators will be for 1 Day. You can change the reading for a different period ranging from 1 Minute to 1 Month. Plus, the technical analysis page displays three different signals: Summary, Oscillators, and Moving Averages, each for a choice of time frames.
Oscillators are usually used by traders to determine if a stock is overbought or oversold. An overbought stock could mean that the stock’s price may be headed for a downward trajectory and a time to exit/sell (or not buy the stock). Conversely, an oversold stock may mean that the stock is poised for an upward trajectory, and this might be the right time to enter the stock, if supported by the fundamental study.
Traders use multiple oscillators to arrive at their buy/sell decision and to confirm the price ranges of stock. TipRanks uses the Relative Strength Index (RSI) and the Stochastic Oscillator as some of the important metrics in its calculations. Both RSI and Stochastic oscillators are momentum oscillators used to study the price movements of a stock. The RSI is a technical indicator that works by measuring the speed and volume of the price movement of a stock. The stochastic oscillator compares the position of the most recent closing price of a stock with its highest and lowest trading prices during a given time frame.
Moving Averages provide insight into the trend of the security by smoothing out its price data and highlighting the overall direction of the trend. For example, a stock’s 50-day moving average shows the average price over the past 50 days, which can help identify a bullish or bearish trend. A bullish trend means the stock’s price is moving upwards, while a bearish trend means the price is moving downwards.
The Summary provides a combined picture of the Oscillators and Moving Averages of the stock, as calculated by TipRanks.
For each of the three indicators in the chart, you will see a Buy, Sell, Strong Buy or Strong Sell, or Neutral Signal. TipRanks calculates the signals based on the total number of Bearish, Neutral, and Bullish signals. By looking at the individual signals and the Summary Signal, you can decide if it is the right time to enter the stock. The Summary Signal takes into account both the Oscillators signal and the Moving Averages signal.
Furthermore, below the chart, you will see details about a few indicators and what they suggest. These include the stock’s Moving Averages Convergence Divergence (MACD) indicator, 20-Day exponential moving average, and its 50-Day exponential moving average. For instance, if the exponential moving average is below the current stock price of the company, it could suggest a Buy.
Further below, you will see the Pivot Points of the stock. Pivot Points help identify key Support (S1, S2, and S3) and Resistance (R1, R2, and R3) levels by calculating the average of a stock’s high, low, and close prices. These levels also can be used to determine when to enter or exit a trade. These points are available for both the Classic and Fibonacci figures.
Further down on the page, you will find a table showing the different Moving Averages numbers including MA5, MA10 up to MA200. Plus, another table displays the Value and Action calculated by the different Technical Indicators. These include the RSI (14), STOCH (9,6), MACD (12,26), Williams %R, Ultimate Oscillator, etc.
To sum it up, all these different indicators and the signals generated by each help you to identify the correct timing to buy or sell a stock. By combining the technical indicator signals with the fundamental research tools, you can decide which stock should be added or removed from your portfolio to maximize returns.
How to Use the Technical Analysis Tool in Your Investment Strategy
While studying the fundamentals of a stock is important to understand if the stock is worth investing in, the technical analysis tools help you to decide the right time to enter or exit the stock. By studying the past behavior of a stock’s price and volume, you can predict the future performance of a stock’s price. What’s more, past behavior forms a pattern for the stock’s future movement. That can be used to determine whether the stock is moving towards the bullish trend or the bearish trend.
To study the technical indicators correctly, it is important to follow a disciplined approach. In the above section, you learned about the various technical indicators such as RSI, Stochastic Oscillators, etc. that TipRanks uses to calculate the Buy/Sell signals. Next, it is important to understand how these signals work and what they imply about a stock’s future trajectory.
We can learn about using the technical indicators in our investment strategy with the help of the example of iPhone maker Apple (NASDAQ:AAPL). Below is the screenshot of Apple’s stock chart plotted along with the technical indicators, namely 50-Day EMA (exponential moving average), 20-Day EMA (exponential moving average), RSI (Relative Strength Index), and Pivot Points.
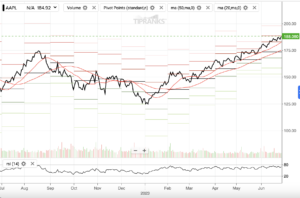
The technical analysis study shows that AAPL stock is poised for further upward movement. Its 50-Day EMA is 170.52, while its last closing price is $188.06, implying a bullish signal. Further, its shorter-duration EMA (20 days) also signals an uptrend.
Additionally, Apple’s RSI at 71 does not signal an overbought condition (an RSI above 80 means overbought, and below 20 means oversold). At the same time, while Apple stock is in an uptrend, it could face immediate resistance at $189 (based on Pivot Points).
By studying these factors and several more that are available on TipRanks’ Technical Analysis page, you can make an informative and timely decision to enter or exit a stock at the given price.
And finally, by looking at the Summary of All Indicators chart, you will see that the Oscillators display a Buy signal, while the Moving Averages present a Strong Buy signal. A combined Summary signal presents a Buy view based on three Bearish, five Neutral, and 14 Bullish signals (refer to the chart below).