Flying Higher
In the rapidly evolving Industrial sector, the Aerospace & Defense industry stands as a testament to human ingenuity and strategic foresight. This industry, encompassing a broad range of activities from aircraft manufacturing to defense contracting, has become an integral part of global infrastructure and security.
Beyond its significant role in global security and military applications, the Aerospace & Defense industry also plays a crucial part in civil aviation, contributing significantly to commercial air travel and private aviation. This dual nature of the sector, straddling both defense and civilian spheres, adds layers of complexity and opportunity.
The Industrial sector as a whole, and the Aerospace & Defense industry in particular, are marked by their constant pursuit of innovation, adapting to technological advancements, and shifting geopolitical landscapes. The companies in the industry operate in a complex and highly regulated environment, balancing the demands of cutting-edge technology with stringent safety and compliance standards, particularly in the realm of civil aviation.
Investors in this industry are privy to a unique blend of challenges and opportunities. The sector’s resilience in the face of economic fluctuations, its commitment to technological advancement, and its strategic role in both military and civil global affairs make it a compelling area for investment. As the world becomes increasingly interconnected and as new frontiers in aviation are explored, the Aerospace & Defense industry stands ready to meet these challenges, promising both growth and innovation in the years to come.
We will present one of the leading companies in this industry, but first, let’s delve into a short update on the economy and markets, and the Smart Investor calendar.
Economy and Markets: Looking Forward
There are several important reports scheduled to be published in the next few days.
-
Later today, the U.S. Bureau of Economic Analysis will release the second estimate for Q3 2023 GDP Growth Annualized. This report will provide an update to the initial estimate of the U.S. economy’s health in the previous quarter, incorporating fresh data received after the first estimate’s release. The third quarter’s economic growth is expected to come in at an even stronger pace than was previously estimated, with analysts penciling in a 5% annualized growth rate (versus the initial estimate of 4.9%).
-
On Thursday, the U.S. Bureau of Economic Analysis will publish October’s Core Personal Consumption Expenditures (Core PCE) report. This report reflects the average amount of money consumers spend monthly, excluding seasonally volatile products such as food and energy. FOMC policymakers use the annual Core PCE Price Index as their primary gauge of inflation. Analysts expect the Core PCE to mimic the disinflation trend seen in the CPI report, slowing further from September.
-
On Friday, the Conference Board will release October’s ISM Manufacturing PMI data. This report shows business conditions in the U.S. manufacturing sector; it is a significant indicator of the overall economic conditions. PMIs are considered to be some of the most reliable leading indicators for assessing the state of the U.S. economy, helping analysts and economists to correctly anticipate changing economic trends. In contrast to other economic sectors, manufacturing has been declining for 11 months; in October, it’s expected to have notched down deeper into the contraction territory.
As for the stock calendar, the Q3 2023 earnings season for Smart Investor Portfolio companies is winding down, with no earnings reports scheduled to be released this week.
The ex-dividend date for ITT (ITT) is November 30th, for UnitedHealth (UNH) –December 1st, and for Cigna (CI) it is December 5th.

Today, we are adding the stock of an industrial conglomerate from the Aerospace & Defense industry whose commercial brands are one of the best-known around the world.
To make room for this valuable addition, we are letting go of a resource company whose decision to sell its largest and most profitable business unit leaves it with no margin of safety.
New Addition: Textron (TXT)
Textron, Inc. is a multi-industry company, operating in the aircraft, defense, industrial, and finance businesses worldwide.
The company conducts its business through six operating segments: Bell, Textron Aviation, Textron eAviation, Textron Systems, Industrial, and Finance.
The Bell segment supplies military and commercial helicopters, tiltrotor aircraft, and related spare parts. The Bell Military subdivision produces military helicopters, tiltrotors, and unmanned aircraft. The Bell Commercial subdivision produces helicopters for private use, as well as helicopters for law enforcement, search and rescue missions, training, utility services, and more.
The Textron Aviation segment manufactures, sells, and services Beechcraft and Cessna aircraft brands. In addition, the segment provides airborne solutions for government, military, and commercial customers, and also develops, manufactures, and maintains state-of-the-art flight or maintenance training devices for the needs of the civil and defense aviation markets. Further, the segment includes the Textron Aviation Defense division, which designs, builds, and supports versatile and globally known military aircraft preferred for training and attack missions. Textron Aviation also operates numerous service facilities worldwide, including mobile service units.
Textron eAviation is focused on sustainable flying, combining Textron’s aircraft expertise with that of its subsidiary Pipistrel, a global leader in electric aircraft.
The Industrial segment designs and manufactures a variety of vehicles and supporting systems and products, such as E-Z-GO golf cars, ELiTE series of lithium-ion-powered electric vehicles, Hauler utility vehicles, Titan industrial burden carriers, Arctic Cat all-terrain vehicles and snowmobiles, Textron GSE tow tractors and belt loaders, Jacobsen turf maintenance equipment, Kautex products and solutions, and more.
The Textron Systems segment develops and integrates multi-domain products, services, and support for customer missions including defense, homeland security, aerospace, and infrastructure protection. The division’s product lines consist of unmanned aircraft systems, land and marine systems, weapons and sensors, as well as a variety of defense and aviation mission support products and services. The Systems division also includes Howe & Howe, a leader in advanced robotic land vehicles.
The Finance segment, operated by Textron Financial Corporation (TFC), is a commercial finance business that provides financing solutions for purchasers of Textron products, primarily Textron Aviation aircraft and Bell helicopters. For more than five decades, TFC has played a key role for Textron customers around the globe.
The company was founded in 1923 as a textile company by the name “Special Yarns Corporation.” By the start of WWII, the company was known as “Atlantic Rayon Corporation” and manufactured parachutes. After the war, the company started making civilian products and was renamed “Textron.” In the 1950s and 1960s, Textron made numerous acquisitions of manufacturing companies in several adjacent and unconnected industries, including Bell Aerospace and E-Z-Go, which helped turn it into an industrial conglomerate. This status was cemented with the divestiture of the textile business in 1963.
Through the years, Textron expanded and diversified its business intrinsically, as well as through acquisitions. The most recent acquisition was that of Pipistrel, maker of the world’s first certified electric aircraft, in 2022, which led to the creation of the Textron eAviation segment.
Today, Textron commands a market capitalization of $15.4 billion and annual revenues of almost $11 billion. The company has 34,000 employees, operating an extensive network of manufacturing, sales, and service facilities in more than 25 countries.
In 2022, Textron Aviation’s share of total company revenues was 39%, while the Industrial segment added 27%. Bell was responsible for 24%, with the income from the U.S. government contracts comprising over 56% of the segment’s sales; Textron Systems’ revenues comprised 9% of the total. Textron eAviation was formed in Q2 2022 and is expected to provide a notable addition to revenue in the next years.
Textron showcases robust financial health. It has a low net debt-to-equity ratio of 26%, with debt well-covered by operating cash flow and interest covered by EBIT many times over. TXT’s short-term assets exceed both its short- and long-term liabilities.
As for capital efficiency, TXT features industry-beating metrics. While its Return on Equity (ROE) of 14%, Return on Assets (ROA) of 6.2%, and Return on Invested Capital (ROIC) of 9% may seem mediocre, they are in the top quarter of the industry’s metrics.
The company’s gross margin is a mediocre 16.3%; however, its operating margin of 8% is better than the industry’s average, while its net profit margin of 7.1% is higher than that of most of Textron’s competitors in the Aerospace & Defense industry, underscoring stable profitability.
On October 26, Textron reported its Q3 2023 results, featuring strong delivery in all business segments. TXT’s EPS exceeded analyst expectations by a wide margin for a third consecutive quarter. In fact, the company’s earnings-per-share beat analysts’ projections in 13 out of 16 past quarters, with two misses and one in-line result. In Q3, revenue rose 9% year-on-year, net income jumped by 20%, and EPS surged 30%. As a result of the strong quarter, the company’s management increased its full-year 2023 adjusted EPS guidance by ~5%.
Total revenue growth in the third quarter was led by the Aviation, Industrial, and Systems segments, while revenues were flat at Bell versus the prior year. Revenue and margin expansion was driven by rising sales, as well as by higher pricing. TXT’s ability to grow sales at higher prices points to its strong competitive advantage and sticky customer base.
Textron’s stock has been performing well versus its peers, as represented by iShares US Aerospace & Defense ETF (ITA). In the past three years, TXT gained 65%, by far beating ITA’s 25% increase. The company’s stock suffered a considerable decline in the spring months of this year, hit by worsening investor sentiment toward industrial companies. However, it rebounded strongly after posting blockbuster Q2 2023 results and added to gains on the recent quarter’s EPS beat. Thus, in the past 12 months, TXT rose by 11%, outperforming ITA’s 7% gain.
Despite the stock’s relative outperformance, Textron remains modestly valued. Its TTM P/E of 16.7 and Forward P/E of 15.7 represent 20% and 24% discounts, respectively, to the Industrial sector’s averages. When compared to the Aerospace & Defense industry averages, TXT’s discount grows to around 40%, pointing at significant value investment potential.
Textron is a dividend-paying company, maintaining quarterly cash payouts since 1980. While its dividend yield is a tiny 0.1%, the long history of uninterrupted dividend payments points to the company’s stability, reliability, and alignment with its shareholders.
In addition to dividends, TXT shareholders are rewarded through generous buybacks. The company’s current stock repurchase program, in place since July 2023, authorizes the management to repurchase up to 35 million shares. In Q3 2023, the company repurchased 3.1 million shares for $235 million. In the first three quarters of the year, Textron repurchased approximately 12.5 million shares, returning $885 million in cash to shareholders.
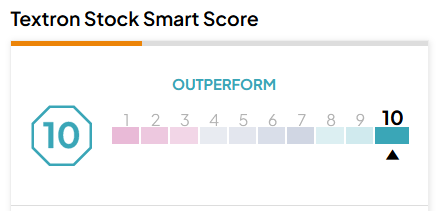
TipRanks-scored top Wall Street analysts see an average upside of 16% for TXT stock in the next 12 months. Textron carries a TipRanks Smart Score rating of “Perfect 10” with a “Moderate Buy” recommendation:
To conclude, we believe that Textron, with its solid finances and robust delivery, underpinned by its strategic expansion and diversified offerings, will continue its solid financial performance in the years to come. TXT’s low valuation, coupled with respectable growth and strong alignment with shareholder interests, make it a valuable long-term addition to the Smart Investor portfolio.
New Deletion: Teck Resources (TECK)
Teck Resources Ltd. is a diversified resource company, which engages in exploring for, acquiring, developing, and producing natural resources in Asia, Europe, and North America. The company’s principal products include steelmaking coal, copper, zinc, and bitumen. It also produces lead, silver, and molybdenum; and various specialty and other metals, chemicals, and fertilizers. In addition, the company explores for gold. The company was founded on September 24, 1951, and is headquartered in Vancouver, Canada.
On November 13th, Teck Resources announced that it would sell its entire steelmaking coal business segment, Elk Valley Resources (EVR), for $8.9 billion. The majority stake of 77% will be purchased by Glencore plc (GB:GLEN), while the minority stake of 20% will be transferred to Nippon Steel Corporation (DE:NPS). Teck expects that the deal will be finalized by Q3 2024.
To underscore, Teck’s coal was not of the carbon-intensive fuel variety, which has been increasingly shunned by investors and scrutinized by regulators. Teck sold coal used to make steel, which is needed to make electric cars, wind turbines, solar panels, trains, rail tracks, bridges, and a million other essential uses. At the moment, there is no alternative to coal in steelmaking, thus, it is a necessity and a lucrative market.
On the one hand, Teck will receive a cash amount as large as half of its market capitalization, which it intends to use to strengthen its balance sheet, return cash to shareholders, and develop its fast-growing copper business segment.
On the other hand, steelmaking coal represents more than half of the company’s revenue and roughly 75% of its gross profit. I.e., the EVR business was financially vital for Teck; it could easily support the company’s continued strive to develop its copper business without a need to sell any assets. Now, the shrunken Teck with much thinner revenue streams emerges as significantly more vulnerable to takeover.
Meanwhile, its Chile copper business is facing difficulties, adding to investors’ worries. The company’s financial results in the recent quarters haven’t been great, with the EPS registering year-on-year declines in the past five quarters, missing estimates in three out of five recent quarters.
So, the sale of Teck’s most profitable segment doesn’t make any sense. That’s why analysts didn’t believe it would happen up to the minute the announcement was made. In fact, Teck has been fighting off Glencore’s takeover attempts for almost a year; the British commodities-trading giant had first attempted a hostile takeover of the whole company early in 2023.
Notably, copper is potentially far more profitable than coal; Teck plans to use the acquired funds to double its production of industrial metal by 2026. However, copper prices are notoriously volatile, i.e., Teck’s revenues will fluctuate with the prices of the metal, without a diversifier to stabilize the income streams. Besides, Teck’s existing and planned copper capacity is relatively cost-intensive, which means that the company’s margin of safety becomes paper-thin. In addition, while Teck’s coal was mined in Canada, all of its copper mines are abroad, increasing its vulnerability to foreign regulations and political instability.
Teck Resources is one of the oldest holdings in the Smart Investor portfolio, acquired in December 2021. Since then, the company’s stock has fluctuated strongly, but it still has brought Smart Investors a gain of 32% since its purchase. With the uncertainty regarding the company’s future after the coal business sale, we believe it is prudent to take out the profit and sell the stock.
Charter Members of the 30% Winners Club
*The 30% Winners Club includes stocks from the Smart Investor Portfolio that have risen at least 30% since their purchase dates.
The markets have been placid in the past week, notching small gains. Our exclusive club’s ranks would have remained unchanged, had we not sold TECK, which has been fluctuating around the 30% threshold for the past several weeks.
Now, the Winners Club still includes five stocks: GE, AVGO, ANET, ORCL, and CDW.
The first in line to enter the ranks of the Winners is still Molina Healthcare (MOH), but with a gain of 20.6% since purchase, it has a lot of ground to cover. Will it be able to close the gap, or will someone else outrun it to the finish line?
What’s Next?
Our next commentary will come out on Wednesday, December 6th, before the market opens.
Until then – we wish you a world of investment success!
Access the full Smart Investor Archive, including all historical stock picks and original newsletters.
Portfolio Changes
|
Disclaimer
The information contained in this article represents the views and opinions of the writer only, and not the views or opinions of TipRanks or its affiliates and should be considered for informational purposes only. TipRanks makes no warranties about the completeness, accuracy, or reliability of such information. Nothing in this article should be taken as a recommendation or solicitation to purchase or sell securities. Nothing in the article constitutes legal, professional, investment and/or financial advice and/or takes into account the specific needs and/or requirements of an individual, nor does any information in the article constitute a comprehensive or complete statement of the matters or subject discussed therein. TipRanks and its affiliates disclaim all liability or responsibility with respect to the content of the article, and any action taken upon the information in the article is at your own and sole risk. The link to this article does not constitute an endorsement or recommendation by TipRanks or its affiliates. Past performance is not indicative of future results, prices, or performance.