| Learn

Table of Contents

TipRanks – Customized for You

How to Create an Account on TipRanks

To start your investment journey on TipRanks and to avail yourself of the full benefits of all features, start with signing up for the TipRanks platform. On the top right of the TipRanks page, you will see the Login/Join button. For a first-time user, click on the Join button that will take you to the Sign-Up page. Here, you have three options: Sign Up with an existing Google account; Sign Up with an existing Facebook account; OR Sign Up with another personal email account. If you would like to use your Google or Facebook account to sign in, you can do so by inputting the respective passwords and successfully logging in to TipRanks.

To create a login with a personal account, first, add your email ID, and then you need to check the I’m not a robot option. This will show you a small pop-up window that will ask you to verify some images. Once you are verified, you need to go through the terms and conditions page of using the TipRanks portal and then check the box which reads, “I agree to TipRanks’ Terms of Use and Privacy Policy.”

After this step, click the CONFIRM button, which brings you to select a password for your new TipRanks account. After you add a password, click on JOIN, which will send a confirmation email to the email address that you are using for signing in. When you open your email, you will see a confirmation email to click on, and voila, you have become a member of the TipRanks Community. After this step, you can go back to the TipRanks main page and LOGIN with your email account and password.

Haven’t created a TipRanks account yet? Click here to join the growing TipRanks community TipRanks | Stock Market Research, News and Analyst Forecasts – TipRanks.com 

How to Use TipRanks on Your Smartphone 

Do you need investment advice on the go? Do you like to keep updated with the latest market happenings at all times? Download the TipRanks platform on your smartphone and explore the benefits of TipRanks tools at your fingertips!

To use TipRanks on your smartphone, visit the Google Play Store on your Android phone or the Apple App Store on your iPhone, search for the TipRanks Stock Market App and download the same on your smartphone. Once downloaded, you can sign up/log in to the App and start your investment journey.

How to Navigate the TipRanks Dashboard and Access Its Features

Once you have become a member of the TipRanks community, the platform provides you with multiple features that are designed to smoothen your investment decisions. Read on to find out more about these unique features.

On logging into the TipRanks portal, the dashboard will show you several features, a few of which are open and available to all Basic users, while others are locked and available for Premium Subscribers only. Right on top of the page, you will see various tabs for the main features, which have numerous options under each. These features and sub-segments can be browsed by clicking on them.

  1. Stock Ideas – Under this feature you will find a host of unique research tools designed to improve your investment acumen. Some of the notable ones include Top Analysts Stocks, Top Insider Stocks, a Stock Comparison Tool that lets you compare stocks from similar industries or undertake customized analysis, and various Calendars including Earnings, Dividend, and Economic calendars.
  2. ETFs – Under this feature, you will find all the information and news related to  exchange-traded funds (ETFs). You have the ETF Research Tools that include the ETF Center, ETF Screener and a tab to Compare ETFs. Similarly, you will find a page on ETFs on the Move including the Top ETF Gainers and Losers and the Most Active ETFs. And lastly, you will find the ETFs Ideas tab, which has a list of ETFs categorized based on sectors, indexes and types.
  3. Dividends – Next you have the Dividend feature, which includes all data related to dividends. These include the Dividend Calculator, lists of Best Dividend Stocks as well as Best High Yield Dividend Stocks, and a tab for Dividend Stock Comparison.
  4. Experts – Have you ever tried making investment choices based on an expert’s recommendations? Well, you can do so through the TipRanks Experts feature. Under the Experts tab, you will find the performance and track records of various investment gurus, namely, Top Wall Street Analysts, Top Financial Bloggers, Top Performing Research Firms, Top Corporate Insiders, Top Hedge Fund Managers, and Top Individual Investors. By studying an expert’s view on a stock, you can make an informed investment choice. You may choose to follow any of the experts from the curated list of more than 32,000 expert recommendations that TipRanks consolidates for you.
  5. Portfolio – Under this popular feature, you can create your own customized portfolio and stay updated with its real-time performance. You can view your portfolio’s Holdings as well as undertake Portfolio Analysis and study Crowd Insights, which lets you compare your portfolio with the Average Portfolio performance on TipRanks. Finally, you can create your own Watchlist on TipRanks, and follow the latest happenings and performance of the stocks that you like as well as set alerts for them.
  6. News – Stay abreast with all the latest stock market happenings under one roof. Under this tab, you will find Stock Market News, i.e., the breaking news flashes, Stock Analysis & Ideas that involves in-depth research on companies and sectors, ETF News, Global Market News, and the Expert Spotlight tab that includes analysis pieces on the top recommendations of experts. Further, we have the TipRanks Labs tab that has educational content on evergreen topics and those related to TipRanks. Then we have the Earnings Reports Insights giving briefs about company results, Market Breakdowns that include the daily Futures and Stock Indices’ performance, Dividend Stock News, and Cryptocurrency News.
  7. More – Under this tab, you will find the About TipRanks information and contact information. Plus, you will find different ways of partnering with TipRanks such as Enterprise Solutions, Best Online Brokers, and Become an Affiliate segments, where you will see all the benefits of joining the TipRanks Affiliate Program. Further, you will find the Education feature, under which you will find the TipRanks Labs section, TipRanks’ Webinar Center (informative videos), Glossary of all the important terms, and a list of FAQs.
  8. Plans & Pricing– As the name suggests, here you will find all the information related to TipRanks’ Subscription Plans. Other than the Basic free plan that gives you limited access to TipRanks tools and data, we have two plans: the Premium Plan and the Ultimate Plan. You can learn about the features of both plans on this page.

Below the top navigation menu, you will see the live market data, through which you can keep up with the real-time market prices for stocks and indices. For instance, we present the U.S. Futures readings, Nasdaq (NDX) readings, a few trending companies’ price movements as well as cryptocurrency prices. As you scroll down, you can see the headlines for the latest Stock Market News, Stock Analysis & Ideas list, and your recently searched stocks list.

Below that, you can see the Stocks On the Move segment, which will show you the Top Gainers, Losers, and Most Active Stocks. Similarly, you can see the Daily Analyst Ratings’ Buy and Sell recommendations, and noteworthy Today’s Events list, which includes Earnings, Ex-dividend dates, and upcoming dividend information.

Further below, you can see the Latest Articles, Trending Stocks, Top Stocks, and Leading Cryptocurrencies. Towards the end of the page, you will see the Analyst Consensus by Sector, the Stock Comparison graphs, and the Top Expert Center.

How to Search for a Specific Stock on TipRanks

If you want to search for a particular stock on TipRanks to study it further with the help of the available tools, type the company name or stock ticker in the Search Bar provided on the top left of the page. When you type, the dropdown window will give you the available options containing that name or ticker. Click on the exact stock that you are looking for and start your research journey using TipRanks’ unique tools.  

For example, if you type TSLA in the search bar, you may see various options in the dropdown including electric vehicle (EV) maker Tesla (NASDAQ:TSLA) and a few other ETF names with the symbol “TSLA” in them.  

How to Search for a Specific Analyst on TipRanks

Have you tried investing with the recommendation of analysts? Before following a particular analyst’s advice, it is best to review the analyst’s past performance and stock-picking prowess. TipRanks helps you do just that! 

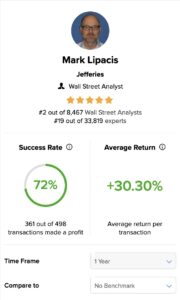
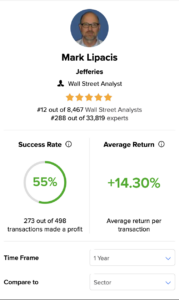
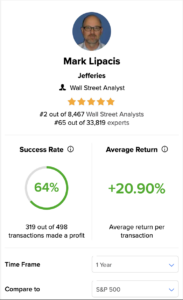
To search for a specific analyst on TipRanks, type the analyst’s name in the Search Bar provided on the top left of the page. When you start typing the name, the dropdown window will give you the matching expert names from its experts’ universe. When you find the exact analyst’s name you were looking for, click on it to learn more about the analyst’s performance, success rate, and stock recommendations.   

Another method is to select the Experts-Top Analysts tab on the TipRanks Dashboard. This will open the analyst list on TipRanks, listed according to their latest Star Ranking. You can browse through the list to search for a particular analyst and learn more about them.  

How to Personalize TipRanks According to Your Investment Strategy

The TipRanks portal helps you to personalize your dashboard in numerous ways, and choose what you wish to see, the way you wish to see it! While TipRanks does not tell you where and how to invest, its tools can aid you to research stocks thoroughly and choose wisely. Additionally, the TipRanks portal allows you to set alerts for different stocks, analysts, insiders, or bloggers to receive instant notifications about new ratings. Plus, you can create your preferred portfolio as per your risk-reward appetite. 

Not just that, on our Smart Portfolio, you can customize the portfolio holdings list to include the information you wish to see or go back to the Basic View anytime. Also, you can download the holdings data on an Excel file for reference. You can compare your returns against the Benchmark as well as against the Average Portfolio of all investors on the TipRanks database. This helps you to analyze whether and why your portfolio is under/overperforming relative to peer investors and alter your portfolio allocations as required.  

What’s more, through the TipRanks Smart Portfolio, you can stay up to date with your portfolio performance, and read news related to your portfolio holdings. Even better, with the Ultimate subscription, you can create multiple portfolios.  

How to Customize Your TipRanks Watchlist to Set Up Email Alerts

Are you interested in receiving timely email alerts that can help you make the right investment calls? Well, look no more! TipRanks has numerous useful options to set alerts for the stocks on your watchlist. Under the TipRanks Portfolio feature, there is a My Watchlist tab, where you can create email alerts for the stocks that you follow (5 stocks under the Basic plan, 30 stocks under the Premium Plan). Plus, you can customize the email frequency and settings as per your convenience. You can choose to receive alerts in real-time or a consolidated list in one email per day. To see or modify your Watchlist, click on your Account in the top right corner of the page and select My Watchlist.  

Further, under the Alert Center tab, you can easily Enable or Disable notifications, and see a glimpse of the number of stocks and experts that you follow. You can even choose to set Price Action alerts such as 52-week high or low, or percentage increase/decrease in daily stock prices. You can also set Calendar Events alerts for earnings results or dividends.  

You can even add experts you wish to follow under the My Experts tab and set up alerts for New Ratings of stocks that are on your Watchlist. Plus, you can add alerts for corporate insider buy/sell shares as well as for analyst consensus changes. What’s more, you can choose to receive notifications only from experts that have at least a particular star ranking. 

Further, you can subscribe to the Weekly Digest, which gives you a weekly overview of your portfolio’s performance, including any latest activities and events in it. Importantly, please ensure that you add account@tipranks.com to your safe sender’s list to receive regular alerts.   

How to Use TipRanks to Find New Investment Ideas 

TipRanks offers a variety of unique toolsets to supercharge your investment ideas. We consolidate the investment activities of several experts on one platform that can be leveraged to formulate profitable investment strategies. Let us look at each of these idea-generating data points in detail below.  

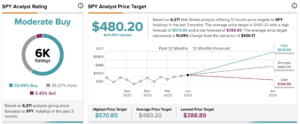
  • Trending Stocks page – You can find this page on the top menu, under Stock Ideas – Daily Updates – Trending Stocks. Trending stocks can help you understand which companies are on analysts’ radar currently, thus helping you to make knowledgeable choices. This page will show you which stocks are generating the most analyst commentary (by 3 or more analysts) in the last few days. You will see the stock’s Rating breakdown, Overall Stock Rating (Buy/Hold/Sell), Average Price Target, and 12-month Upside potential (%).  
  • Analysts’ Top Stocks page – You can find this page under Stock Ideas – Stock Ideas – Top Analyst Stocks. This page will show you a list of stocks on which analysts are highly Bullish. These stocks are most recommended by analysts and have a high probability of achieving the consensus price target as set by the top analysts, thus making for valuable investment advice. The list can be customized to see the stock’s price/earnings per share (P/E) ratio, yearly gain, recent stock behavior, and so on. Moreover, the page will show you the Analyst Consensus by Sector (Strong Buy/Moderate Buy/Hold/Moderate Sell/Strong Sell), featuring stock recommendations by the analysts with the best performance records. 
  • Insiders’ Hot Stocks page – You can navigate to this page from the top menu, under Stock Ideas – Stock Ideas – Top Insiders Stocks. The Insiders’ Hot Stocks page is a screener that focuses on those most in the know-corporate insiders. With 4 pre-set strategies, this powerful screener helps investors reveal which stocks insiders are active in. By following the trading activities of insiders, you can gauge the stock’s future trajectory and make wise trading choices. This page shows you corporate insiders’ views (Positive/Neutral/Negative) on stocks based on their insider stock trading activity. 
  • Stock Screener page – You can navigate to this page from the top menu, under Stock Ideas – Stock Ideas – Stock Screener. This page helps you to filter and compare stocks based on specific criteria. You can customize your list based on several parameters such as sector, price target upside, analyst consensus, insider signal, etc.   
  • Top Smart Score Stocks page – You can find this page on the top menu, under Stock Ideas – Stock Ideas – Top Smart Score Stocks. This page displays a list of the best stocks with a TipRanks Smart Score of “Perfect 10.” As per the Smart Score, these companies are highly likely to outperform market expectations. By investing in these Top Smart Score stocks, you can improve your chances of earning outstanding returns. 
  • Top Online Growth Stocks page – You can find this page on the top menu, under Stock Ideas – Stock Ideas – Top Online Growth Stocks. This page shows you a list of companies whose Website Traffic trends have shown substantial growth in the past month, thereby indicating a solid performance. Stocks with a solid online footprint tend to outperform expectations and thus amplify your returns.  
  • Penny Stock Screener page – You can find this page on the top menu, under Stock Ideas – Stock Ideas – Penny Stock Screener. This page shows you a list of penny stocks on which top analysts have a bullish view. Although penny stocks may be risky bets due to their relatively smaller market capitalizations and moats, these stocks have the potential to become multi-bagger investment opportunities.   
  • Compare Stocks page – You can navigate to this page from the top menu, under Stock Ideas – Stock Ideas – Compare Stocks. On this page, you can compare multiple stocks (maximum 10 stocks) of your choice using TipRanks tools such as Analyst Consensus, Price Target, etc. You can customize the parameters on which you want to compare the stocks. Using the tool, you can perform a comparative study of the stocks of your choice and decide which one is most suitable for your investment strategy.  
  • U.S. Stock Movers page – You can navigate to this section from the top menu, under Stock Ideas – Daily Updates – Top Gainers/Losers/Most Active. TipRanks consolidates a list of the 50 most active stocks based on the highest trading volume, including during both pre-market and after-market hours. On the Most Active Stocks page, you will also find tabs to bring you to the Top Gainers and Top Losers of the Day pages, which list stocks with significant price changes. This information helps you to further study why a particular stock may have experienced price fluctuations and decide whether or not to invest in it.  
  • Daily Analyst Ratings page – You can navigate to this page from the top menu, under Stock Ideas – Daily Updates as well as directly from the TipRanks dashboard. This page consolidates the daily stock ratings and price target changes by Wall Street analysts. You can see the Daily Buy and Daily Sell Ratings as well as the Full List of Stock Ratings for the same day and previous days. This information helps you study why an analyst has changed their stance on a particular stock and decide on your investment options accordingly.  
  • Daily Insider Transactions page – You can navigate to this page from the top menu, under Experts – Top-Performing Corporate Insiders – Daily Insider Transactions. This page tracks the daily insider buy and sell transactions of people most in the know. Corporate insiders are privy to information that an average investor may not know. Hence, following an insider’s trading activity can guide us into the stock’s future trajectory and help investors make appropriate trading calls. 

What is the Difference Between TipRanks’ Premium and Ultimate Plans, and Which Should I Buy?

Now that you are aware of the many benefits that TipRanks’ tools offer an investor, it’s time to dive into the details of our subscription plans. TipRanks has two paid subscription plans for users: the Premium and Ultimate plans. As an Ultimate Plan subscriber, more features will be unlocked to facilitate your research journey. To see the features included in each plan, go to the Plans & Pricing tab on the main menu. The gist of the main features of both plans is described below.  

TipRanks Premium Plan – Includes all features including Premium Stock Analysis, which allows you to research any stock with the help of TipRanks’ unique data sets. You can get New Investment Ideas through the Big Data-based ideas using the Top Smart Score stocks, Analyst and Insider stock breakdowns. Moreover, you get access to Smart Portfolio Research tools that include Top Analysts’ Price Targets and Consensus, Hedge Funds, Insider signals, etc. Also, subscribers gain access to all Premium Research Tools including stock screeners and earnings calendar, receive Daily Expert Insights of real-time stock recommendations and transactions, and get Premium Expert Access to the views of Wall Street analysts, Hedge fund managers, Corporate Insiders, and Bloggers. Plus, you get to personalize your email alerts or Follow 30 Stocks of your choice and have the option for PDF Export of data as well as Priority Support.   

TipRanks Ultimate Plan – includes all features of TipRanks Premium, along with access to a larger set of TipRanks’ unique tools. These include Stock Risk Factor Analysis, which displays the potential risks the stock is exposed to through the reports available at the SEC. Get a list of daily Insiders’ Hot Stocks that exhibit Strong Buy indicators based on corporate insiders’ trading activities. Plus, you get access to Popular Websites Screener, which lists companies with the most trending website traffic trends and get Research Firm Rankings to choose which analysts should be followed based on the popularity of the firms they work for. Furthermore, get a list of Complete Expert Rankings to scan the best-performing experts over longer or shorter time periods, as well as compare an expert’s performance against the performance of its overall Sector or against the S&P 500 (SPX) index. What’s more, you can avail yourself of email alerts for an Unlimited number of stocks, and you get both PDF+CSV download options and VIP support for troubleshooting.   

Now that you are well versed with the different features of both plans, you can choose between them depending on your investment objective. Premium is our most popular plan, as it gives you access to many tools and data you need to make data-driven investment decisions. That being said, Ultimate is becoming increasingly popular with investors who enjoy full access to all of TipRanks’ tools. Additionally, you can take advantage of our 30-day money back guarantee when you buy or upgrade to a yearly plan. 

How to Use the TipRanks Research Reports to Gain In-depth Insights on Specific Stocks

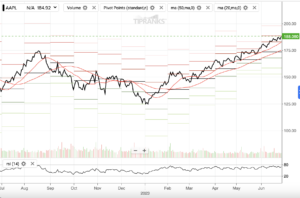
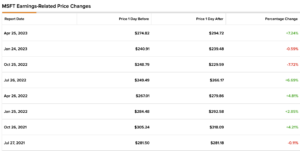
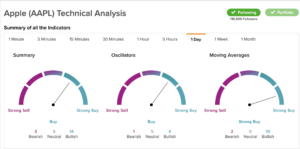
The TipRanks Stock Report is a detailed report of all the pages from the TipRanks website related to the stock, which enables in-depth analysis of the company. You can study the different tools measuring the stock including its Stock Analysis, Financials, Smart Score, Stock Forecast & Price Target, Technical Analysis, Insider Trading tool, Hedge Fund Trading Signal, and more. Additionally, you can click on any news item on the stock report and open it on the browser to read further.  

You can find the TipRanks Research Report on the left navigation bar on a stock’s page. When you click on the report, TipRanks will email the entire report to your registered email address in pdf format, within minutes. The pdf format enables easy downloading, readability, and study of the stock. 

All the Charts You Will Find on the Stock Analysis Page, and How to Use Them in Your Investing Strategy 

The TipRanks Stock Analysis Page shows various charts that can assist you in selecting stocks. As explained in the section above, the Stock Chart & Stats section displays all the important share-related data and financial metrics of the stock’s past, present, and future performance.   

Further, the Stock Smart Score chart shows the TipRanks Smart Score for the stock, which is derived from the 8 key market factors of a stock. Plus, the Smart Score chart shows you how the stock is performing according to each of the eight different components of the score. A score between 8 to 10 implies a higher potential to outperform market expectations and thus an apt choice to add to your portfolio. On the other hand, a score between 1 to 3 implies a higher probability of underperforming the market and hence a wise decision to exit the stock.  

As you scroll down, you will find the stock’s News section. You will find the headlines of all the latest news on the stock. Click on any headline to read the full article.  

Besides the news section, you will find the basic Company Description including its Business Model, Sector and Industry focus, name of the company’s CEO, number of Employees, the corporate Website address, the ISIN number, and the company’s corporate headquarters Address. 

Further below, you will see six other sections. One displays the list of the Top 5 ETFs holding the stock. You will see the Name of the ETF, its Market Value, and the ETF’s Smart Score on the table.   

Next, you will see a section on the Financials of the stock. Here, you can see important line items from the Income Statement namely, Revenue, Earnings, and Profit Margin plotted on a graph for various time periods. You can click on the Balance Sheet tab to view the Assets, Liabilities, and Debt to Assets ratio plotted on a graph. And lastly, you can view the cash flow generated by the Operating, Investing, and Financing activities plotted on a graph for different time periods on the Cash Flow tab. For all these tabs, you can switch between the Annual and Quarterly time frames. 

Additionally, you can study the stock’s historical earnings beat/miss performance, on the Forecast EPS vs Actual EPS graph for six quarters. The graph gives information on the EPS Estimate, earnings Beats, and earnings Misses.    

Further down on the page, you will see three small charts. One will show you the stock’s Main Risk Category, which can be studied further by going to the stocks’ Risk Analysis page. Next, you will see data on the Product Monthly Users (number of people who visit the stock’s website), which is linked to the stock’s Website Traffic page. And a third chart shows you a list of Similar Stocks, with the Company name, the Price & Change for one day, and the option to Follow.  

Stock Analysis Pages

How to Understand the TipRanks Smart Score

The Smart Score is a proprietary quantitative stock scoring system created by TipRanks. We calculate the Smart Score based on a combination of eight key factors and derive a ranking from 1 to 10, with 10 being the best, called the “Perfect 10” Smart Score. A lower score, of between 1 and 3, indicates that the stock will underperform market expectations; a score between 4 and 7 implies the stock will perform in line with market expectations; and a score between 8 and 10 implies the stock will outperform market expectations. Based on a study of a stock’s Smart Score, you can decide whether to invest in the stock.  

The score is data-driven and does not involve any human intervention. Six of the eight market factors which are incorporated into the Smart Score calculation are unique to TipRanks; only the technical and fundamental factors are not. The Smart Score is updated every day using data from the end of the previous day. 

The contributing market factors are: 

  • Wall Street Analyst Consensus 
  • Financial Blogger Sentiment 
  • Hedge Fund Trend 
  • Corporate Insider Transactions
  • Crowd Wisdom (retail investor sentiment) 
  • News Sentiment 
  • Technicals 
  • Fundamentals 

To view the Smart Score of any stock, go to the Stock Analysis page of the stock. On the page, you will see the Smart Score in a graphical representation. Plus, the Smart Score chart shows you how the stock is performing according to each of the eight individual components of the score. 

The Smart Score is also useful for investors who are faced with contradictory signals on a stock. For example, how can you assess a stock when analysts are saying Buy, yet Hedge Funds are selling? When you research a stock on TipRanks, you can see its Smart Score, which gives you an overall assessment of the stock, as well as an overview of the underlying factors. 

From our historical study, it has been proven that stocks with a high smart score have the potential to outperform market expectations and are thus an apt fit for your portfolio. Our studies, which have been back-tested to 2016, found that the returns generated by stocks with a high Smart Score have historically outperformed those generated by the S&P 500 (SPX) index.  

How to Use the TipRanks Smart Score in Your Investment Strategy 

One of the biggest challenges that investors face is how to conduct comprehensive research, especially when there is contradictory data about a single stock. The TipRanks Smart Score provides you with a data-driven score, giving you a simple way to assess a stock’s potential. The score is 100% driven by data and does not involve any human intervention. 

The TipRanks Smart Score measures stocks on 8 key market factors and scores them from one to ten. Through our studies, which are back-tested to 2016, we have learned that the returns generated by stocks with a high Smart Score have historically outperformed those generated by the S&P 500 (SPX) index.  

So, how can you use the Smart Score to aid your stock-picking journey? We have a solution for you. TipRanks consolidates a list of stocks with a Perfect 10! Smart Score under the Top Smart Score Stocks screener page. This list helps investors analyze stocks easily and quickly. You can find this page on the top menu, under Stock Ideas – Top Smart Score Stocks.  

You can access this list to see which stocks have the best possible chances of outperforming market expectations. Not just that, the Smart Score also rules out the likelihood of relying on just one indicator, such as analyst rating or corporate insider trading activities. By giving a combined data-driven score based on eight different factors, Smart Score eliminates bias and gives you a more refined list of the best stocks. By investing in these Top Smart Score stocks, you can improve your chances of earning outstanding returns.  

On the Top Smart Score Stocks page, you will see a graphical representation of the Top Smart Score Stocks’ Performance (since 2016). The chart shows the Total Return generated by the Top Smart Score stocks since 2016, the Alpha Over the S&P 500 (excess returns earned over the SPX), and the Average Annualized Return.  

Below this chart, you will see the table of the Stocks with Highest Smart Score (the top 5% of stocks from the TipRanks rating system). 

The list displays the Name and ticker symbol of the company, the latest stock Price, the Price Change for one day, the Sector to which the stock belongs, the number of days when the stock has a Top Score Since, the Market Cap of the stock, P/E Ratio, Yearly Gain (in % terms), Price Chart (7 days), Smart Score, and the option to Follow the stock. 

Moreover, you can choose to view the list as per the data you choose by ticking elements under the Select Columns tab. Plus, you can filter the list for the Market Cap (Mega/Large/Medium/Small/Micro), the Sector focus, and the Top Score Since. The Top Score Since tab is important as it tells you the consistency of the stock’s Top Smart Score. The tab has options, namely Last 24 Hours, Last Week, Last 1 to 2 Weeks, Last 2 to 4 Weeks, and More than 4 Weeks. The higher the number of days for which the stock has maintained a Top Smart Score, the better, as it implies the stock has been performing excellently on all 8 key factors for quite a while. As with all TipRanks tools, you can select the geography for which you want to see the list of Top Smart Score Stocks.  

How to Read All the Data Points in the “Stock Charts & Stats” Section, and How to Use Them in Your Investing Strategy

On the Stock Analysis page of the stock that you are researching, you will see a Stock Chart & Stats graph at the top. The chart displays the Price Chart of the stock for varying periods ranging from 1 day, 6 Months, 1 Year to 5 Years. When you hover the cursor over the price chart, you can see the latest closing Price and Volume traded for the stock on a particular date. Plus, you have the option to view the chart type in the line format, area format, or candle format.  

Below the chart, you can see information on all the important Stats for the stock as detailed below: 

Popular Statistics – Under this section, you will view the statistics that are most commonly followed to analyze a stock. These include the stock’s Day’s Range (low and high), 52-Week Range (low and high), Previous Close, Volume traded, Average Volume (3M) traded in the last three months, Market Cap (shares outstanding x latest closing price), Enterprise Value, Total Cash and Total Debt as per the latest filing, Price to Earnings per share (P/E) ratio, Beta (risk metric), the Next Earnings date for the quarterly results, the EPS Estimate (earnings per share) for the upcoming quarter, the Next Dividend Ex-Date for the stock, and the Dividend Yield. 

Share Statistics – When you click on the Show More button, you will view some more stats. First come the Share Statistics, which include data on the stock’s share price movement, which is essential to understand how the stock has been behaving in the past. The metrics include EPS (TTM) – earnings per share for the trailing twelve months, Shares Outstanding as of date, and the stock’s trading volume based on 10 Day Avg. Volume and 30 Day Avg. Volume, Standard Deviation of the stock (market volatility, a lower number is better), R-Squared (higher value shows higher correlation with the benchmark), and the stock’s Alpha (excess return on investment). 

Financial Highlights & Ratios – This section includes important ratios and financial figures that will give you a clue into the stock’s financial health. The metrics include Price to Book (P/B) ratio, Price to Sales (P/S) ratio, Price to Cash Flow (P/CF) ratio, Price to Free Cash Flow (P/FCF) ratio, Enterprise Value/Market Cap, Enterprise Value/Revenue, Enterprise Value/Gross Profit, and Enterprise Value/EBITDA (Earnings before interest tax depreciation and amortization). 

Forecast – This section includes the forecasted metrics that help in understanding the stock’s future trajectory. The information includes the 1Yr Price Target on the stock (as derived from analyst ratings), the related Price Target Upside for the stock for the next 12 months, the average analyst Rating Consensus on the stock, and the Number of Analyst Covering the stock. 

Investors often study both the fundamental and technical analyses of a stock before making an investment decision. By studying the past performance, present performance, and future expectations of a stock in the Stock Chart & Stats section, you can decide whether it is meaningful to invest in the stock.  

All the Charts You Will Find on the Stock Analysis Page, and How to Use Them in Your Investing Strategy 

The TipRanks Stock Analysis Page shows various charts that can assist you in selecting stocks. As explained in the section above, the Stock Chart & Stats section displays all the important share-related data and financial metrics of the stock’s past, present, and future performance.   

Further, the Stock Smart Score chart shows the TipRanks Smart Score for the stock, which is derived from the 8 key market factors of a stock. Plus, the Smart Score chart shows you how the stock is performing according to each of the eight different components of the score. A score between 8 to 10 implies a higher potential to outperform market expectations and thus an apt choice to add to your portfolio. On the other hand, a score between 1 to 3 implies a higher probability of underperforming the market and hence a wise decision to exit the stock.  

As you scroll down, you will find the stock’s News section. You will find the headlines of all the latest news on the stock. Click on any headline to read the full article.  

Besides the news section, you will find the basic Company Description including its Business Model, Sector and Industry focus, name of the company’s CEO, number of Employees, the corporate Website address, the ISIN number, and the company’s corporate headquarters Address. 

Further below, you will see six other sections. One displays the list of the Top 5 ETFs holding the stock. You will see the Name of the ETF, its Market Value, and the ETF’s Smart Score on the table.   

Next, you will see a section on the Financials of the stock. Here, you can see important line items from the Income Statement namely, Revenue, Earnings, and Profit Margin plotted on a graph for various time periods. You can click on the Balance Sheet tab to view the Assets, Liabilities, and Debt to Assets ratio plotted on a graph. And lastly, you can view the cash flow generated by the Operating, Investing, and Financing activities plotted on a graph for different time periods on the Cash Flow tab. For all these tabs, you can switch between the Annual and Quarterly time frames. 

Additionally, you can study the stock’s historical earnings beat/miss performance, on the Forecast EPS vs Actual EPS graph for six quarters. The graph gives information on the EPS Estimate, earnings Beats, and earnings Misses.    

Further down on the page, you will see three small charts. One will show you the stock’s Main Risk Category, which can be studied further by going to the stocks’ Risk Analysis page. Next, you will see data on the Product Monthly Users (number of people who visit the stock’s website), which is linked to the stock’s Website Traffic page. And a third chart shows you a list of Similar Stocks, with the Company name, the Price & Change for one day, and the option to Follow.  

ETF Center

How TipRanks Determines the Analyst Forecast for ETFs

We all know how useful Wall Street analysts’ forecasts can be when we are forming stock-picking decisions. The same information could help you decide which Exchange-Traded Fund (ETF) best suits your investment goals. TipRanks is the first and only platform to provide analyst forecasts and price targets for individual ETFs.  

TipRanks uses its proprietary technology to calculate the analyst forecast and price targets for ETFs based on a combination of the individual performances of the underlying assets. At a glance, you will see the overall analyst rating, analyst price target, and upside or downside on an ETF.  

Innovatively, we calculate a weighted average number based on the combination of all the ETF’s holdings. For instance, the average price forecast for an ETF is calculated by multiplying each individual holding’s price target by its weight (allocation) in the ETF. 

To navigate to the Analyst Forecasts page of an ETF, first, search for the ETF you are researching using the search bar, by entering either the name of the fund or its ticker symbol. By default, you will be brought to the ETF’s Analysis page. The Analyst Forecasts page appears on the menu on the left-hand panel. 

Just as you study the analyst forecast for a stock on the TipRanks website, you can study the analysts’ forecast on ETFs. TipRanks makes it easy for you to check out the analysts’ consensus forecast before deciding whether to invest in an ETF and incorporate that data into your ETF research. 

We can learn more about the ETF forecast page with the help of a popular ETF, the SPDR S&P 500 ETF Trust (SPY). 

You will see four sets of information on the ETF’s forecast page. These include the Analyst Rating, the Analyst Price Target (for both All Analysts and only Top Analysts), and the list of stocks from the ETF with the Highest Upside and Lowest Downside Potential. Here is a guide to understanding each of those types of data:  

Analyst Rating – SPY is an equity-only ETF with 505 holdings in its portfolio (you can see this information on the ETF’s Holdings page). TipRanks accumulates analyst ratings of all the 505 holdings of SPY to derive a consensus rating, while also giving the breakdown of percentages of Buy, Sell, and Hold recommendations for all its holdings together. 

As seen in the chart above, a total of 6,371 analysts have given ratings for all of SPY’s holdings combined, during the past three months. Out of this, 59.49% have given a Buy rating, 35.07% have given a Hold rating, and 5.45% have given SPY a Sell rating. This results in SPY receiving an overall Moderate Buy consensus rating on TipRanks.   

Analyst Price Target – As seen in the chart, the average SPDR S&P 500 ETF Trust price target is $480.20. This price target is derived by calculating a weighted average number of all analyst price targets given to individual holdings in the ETF. 

The closing price for SPY on June 27 2023, was $436.17. The average target price of $480.20 implies 10.09% upside potential from the last closing price. It is important to note that this upside or downside potential for the average price target will change daily, based on the closing price each day. 

You can also see the highest price target and lowest price target for the ETF; those indicate the most bullish and most conservative price target recommendations for the portfolio. In the case of SPY, the highest price target of $570.85 implies 30.88% upside potential, while the lowest price target of $388.09 implies 10.84% downside potential from current levels. 

Interestingly, you can also switch between viewing the overall analysts’ consensus and only the top analysts’ consensus for the ETFs. The Top Analysts are those with the highest success rates, best average returns earned, and the highest number of recommendations, according to TipRanks’ ranking system. Just above the consensus chart, you can see a taskbar that allows you to choose between the two and view the ratings accordingly. 

Upside/Downside Potential – Surprised by what you read until now? Well, we have more. Along with giving ETF forecasts and price targets, TipRanks also gives a list of the stocks held by the ETF with the Highest Upside Potential and the Lowest Downside Potential. The list will also show you the Price & Change for one day, the Analyst Consensus on that stock, and the Analyst Price Target on the stock. This way, you also get a sneak peek into the top-performing and poorly performing stocks of the ETF’s holdings. You can also click on individual stocks in the list to further research them. 

How to Use the Smart Score to Empower Your ETF Investing Strategy

Just as we calculate the TipRanks Smart Score for stocks using our proprietary technology, we calculate the Smart Score for ETFs. This revolutionary measure is based on the weighted average Smart Score of each holding in an ETF and some additional factors. Weights are derived based on the number of stocks having a particular Smart Score.  

For example, the SPDR S&P 500 ETF Trust (SPY) has a Smart Score of 8, which is derived through a weighted average calculation. Among SPY’s holdings, 9.83% of stocks have a Smart Score of 10, 25.43% of stocks have a Smart Score of 9, and so on. We can see much of the information that’s included in the Smart Score on the ETF’s Holdings page, broken down into each individual stock’s parameters. Other data that are included in the Smart Score, such as News Sentiment, Hedge Fund trends, Crowd Wisdom (retail investors), and Technical Factors are calculated based on the actual ETF ticker’s parameters. 

TipRanks calculates the Smart Score based on a combination of all these factors and derives a ranking from 1 to 10, with 10 being the best, called the “Perfect 10” Smart Score. A lower score, of between 1 and 3, indicates that the ETF will underperform market expectations, a score between 4 and 7 implies the ETF will perform in line with market expectations, and a score between 8 and 10 implies the ETF will outperform market expectations. Based on a study of an ETF’s Smart Score, you can decide to whether to invest in an ETF. 

How to Use the ETF Center to Improve Your ETF Investing

Now, let’s see how the ETF Center helps you in optimizing your investments. To navigate to this page, go to ETFs – ETF Research Tools – ETF Center. 

On this page, at the top, you will find the headlines of  TipRanks’ latest news articles on ETFs, under the ETF News tab. Browse through the headlines and click on the link that you wish to read thoroughly. Or click on the More ETF News link to read more news articles.  

Next, you have the option to surf to the ETF Screener and Compare ETFs tools curated by TipRanks. On the ETF Screener page, you will find a list of over 7,000 ETFs tracked by TipRanks. You can compare the ETFs on the Screener based on various parameters available on TipRanks. Meanwhile, on the Compare ETF page, you can compare up to 20 ETFs of your choice, based on a few pre-defined parameters. 

As you scroll down further in the ETF Center, you will find a list of the ETFs on the Move, and the Top ETFs by Assets Under Management (AUM).  

The ETFs on the Move feature displays the top 5 ETFs that have experienced the biggest price increases (Top Gainers) and decreases (Top Losers) in real-time, along with the 5 most actively traded ETFs (Most Active). This feature helps you identify potential ETF investment opportunities. At a glance, you will see the name and ticker symbol of the ETF, the Price & Change for one day, and the Volume of shares traded by the ETF. 

The Top ETFs by AUM feature displays a list of ETFs ranked by the total value of assets they hold. AUM is a commonly used metric to evaluate the popularity and success of an ETF. The higher the AUM, the more money investors have put into that ETF. This feature can help you quickly identify the most popular ETFs in the market, allowing you to make informed investment decisions. At a glance, you will see the name and ticker symbol of the ETF, the Country focus of the ETF, and the AUM amount in billions of dollars.  

And lastly, on the ETF Center page, you will see several lists of the top 5 players in their respective fields, under the Major ETFs by Categories tab. These categories include the S&P 500 Sector, Bonds, Commodities, Currencies, U.S. Industries, Country specific ETFs, Factor ETFs, Size and Value ETFs, Fixed-Income Factor ETFs, and more.   

How to Use the Compare ETF Page to Improve Your ETF Investing

The TipRanks’ Compare ETF page aids you in comparing up to 20 ETFs of your choice based on a few pre-defined parameters. To navigate to this page, go to ETFs – ETF Research Tools – Compare ETFs.  

Once you select the ETFs to compare, the data will be populated in table form. The list includes the following parameters under different tabs, as follows: 

  • Overview – includes the ETF Symbol, ETF Name, the Price & Change (%) for one day, the ETF’s Expense Ratio, price change for 1 Year (in %), the ETF’s AUM, the Smart Score, and the option to Follow the ETF. 
  • ETF Facts – provides information including the Index Name that the ETF tracks, Asset Class, Region focus, Category, Strategy employed, AUM, etc. 
  • TipRanks Essentials – includes TipRanks unique toolsets such as the ETF’s Analyst Price Target, Hedge Fund Signal, Insider Signal Strategy, News Sentiment, and the ETF’s Smart Score. 
  • Dividend – provides information on the ETF’s Ex-Dividend Date, Payment Date, Dividend Yield, Last Dividend Amount, and the total Dividend Amount in the last four quarters. 
  • Technicals – includes Average Volumes for different time frames, as well as a few Moving Averages. 
  • Performance – displays the percentage change in the price returns for varying periods ranging from 1 Day, 1 Month, 1 Year, Year-to-Date, and up to 5 Years.   

That’s not all! The Compare ETF page also displays a Performance Comparison chart that displays a line graph for each selected ETF since May 2020. TipRanks considers May 2020 as the base (0.00%) for this comparison and shows how much an ETF has gained/lost (% terms) as of a particular date, since the base date. You can hover over the line graphs on different dates to see the comparative performance of each ETF. By studying this chart, you can easily see how the ETFs have fared historically in terms of their prices and find out which one has offered the best returns. 

Additionally, you can customize and select other data points that you wish to see on a dropdown list under the Select Columns tab on top of the table. The Compare ETF page can assist you in thoroughly comparing ETFs and deciding on the best one to invest in.  


Smart Portfolio

How to Create a New Portfolio on TipRanks

TipRanks has a host of beneficial investment research tools that can aid you in creating a robust portfolio. You can create your own Smart Portfolio on TipRanks and keep track of your holdings with the myriad tools at your discretion. Some of the benefits of the TipRanks Smart Portfolio include trading in fractional shares, viewing the TipRanks Smart Score for stocks, access to both the pre-market and after-hour prices for stocks and so on. To create a New Portfolio on TipRanks, follow the below-mentioned easy steps: 

  • Go to the My Portfolio tab from the Main Menu 
  • Click on Add Portfolio on the top right corner of the page 
  • Start adding stocks (ticker symbol or company name), cryptocurrencies, mutual funds, or exchange-traded funds to your new portfolio as per your choice  
  • You can also directly add a list of sector-specific stocks from our curated lists of Popular Stocks 
  • After adding the required stocks and funds, click on Create 
  • Voila, your new Smart Portfolio is ready 
  • Once created, add the number of shares per holding to see your reported performance in the Number of Shares tab on the holdings list
  • When you add the number of shares, automatically, the Holding Value will be populated for each holding based on the most recent closing price 
  • You will also see the % of Portfolio contribution of each holding in the list  
  • Once all shares are inputted, you will see the Total Holdings (actual dollar amount) on the top left corner of the page 

Once created, the TipRanks Smart Portfolio can be accessed on both desktop and mobile devices. The Smart Portfolio offers a variety of tools to stay updated and track the daily changes in the performance of your chosen stocks or funds. You can even set up alerts to receive regular news related to your portfolio holdings. Moreover, you can compare the performance of your holdings alongside the performance of average portfolios created by users on TipRanks. A balanced portfolio, featuring timely marginal corrections, will provide you with steady results. Combine this with a strategic market outlook, investment education, and timely Buy/Sell signals and you have a complete service that helps you reach your investment goals. To understand these tools in greater detail, read on. 

How to Set Up and Manage the Smart Portfolio Manually (views and columns)

Once you have created the TipRanks Smart Portfolio, you can adjust the information (views and columns) you wish to see on your portfolio holdings page. There are two options to view your portfolio’s holdings information. One is the pre-set view called the Basic View, and the other is the Custom View. Within both views, you can click on any field to sort the list according to the declining or inclining trend of the field. Read on to learn about both views in detail.  

Basic View – Under the Basic View, you will find all the relevant information about your holdings that we believe is essential and primary to track your portfolio performance. In the table, you will see the Name of the security/asset, the latest Price, Price Change (in % terms) from the previous day, Analyst Consensus on the stock (or ETF), Analyst Price Target on the stock (or ETF) with the related upside/downside potential, Top Analyst’s Price Target along with upside/downside potential, TipRanks’ Smart Score for the stock (or ETF), Number of Shares held, current Holding Value of the security, Holding Gain/Loss (in % terms) from the day of addition, Top Analyst Consensus on the stock (or ETF), Insider Strategy Signal, Hedge Fund Signal, and Alerts (latest happenings on the security.)  

Custom View – Under the Custom View, you can select the information you wish to see for your portfolio holdings from a variety of options. These options are populated on a pop-up window under two sections: Basic Selection and Premium Selection (available only to Premium Subscribers). Moreover, you can even Reorder Columns in the order you wish to see them. This can be done by a simple Drag & Drop Field move. 

Besides the options available under the Basic View, several fields are available to customize your holdings data. These include Yearly Gain, Blogger Consensus, Media Buzz, Investor Sentiment, P/E Ratio, Beta, and News Sentiment, to name a few.  

Once you have selected all the fields that you wish to see, click on Apply Columns to view the customized details. At any time, to return to the original list, click on the Reset to Default option and the saved changes will be erased. Now, go ahead and manage your portfolio in the way that best suits your analytical skills.   

How to Sync Your Smart Portfolio with External Brokerages

Do you already have a portfolio that you want to replicate on TipRanks Smart Portfolio to track it effectively? Don’t worry, we have a solution for you! You can import and sync your existing portfolio from all top external brokerages. Importing and syncing your existing portfolio from brokerages also helps you to save time and update your portfolio in real-time. TipRanks partners with several large brokerages, including Ally Financial, Fidelity, Robinhood, Vanguard, E*TRADE, Ameritrade, and more.  

To begin importing your portfolio, first, select the brokerage firm. Start typing in your brokerage’s name in the pop-up window to find it. Once you select the brokerage, you will have to input the relevant Username and Password credentials and press the Submit button.  

After your credentials are verified and authenticated by the brokerage, the page will link to your brokerage account. From there, you can select the portfolio that you wish to sync on TipRanks Smart Portfolio and hit Sync. In a couple of minutes, your portfolio will have synced, and you can start enjoying the benefits of TipRanks tools for your portfolio decisions. Yes, it’s that easy! And that’s not all! The trades that you make in your broker account are also reflected on the TipRanks Smart Portfolio within a day. 

How to Delete a Portfolio

To delete a portfolio from the TipRanks Smart Portfolio page, follow the below-mentioned simple steps: 

  • Click on Manage Portfolios on the top left corner of the My Portfolio page 
  • From the dropdown, select the portfolio that you wish to delete 
  • Besides the portfolio, click on the Delete icon 
  • A pop-up window will ask “Are you sure you want to Delete (portfolio name) from your portfolios?” 
  • Select Delete, and your portfolio is deleted! 

You will no longer see the deleted portfolio on the TipRanks database. 

How to Delete a Stock

If you want to delete a particular stock (asset/holding) from the TipRanks portfolio, go to the holdings list on your portfolio.  

At the end of the listing information, you will see the Delete icon. Once you click on the icon, a pop-up window will ask for your confirmation (cannot be done for portfolios synced with brokerage accounts.) 

Deleting a stock from the portfolio is assumed as the sale of the entire position in the stock. Once you confirm and hit the Delete button, the stock will be deleted from your portfolio.    

How to Use the Portfolio “Analysis” tab to Improve Your Portfolio’s Performance

TipRanks enables you to conduct in-depth portfolio analysis through a variety of unique tools. Go to the Analysis tab on the left navigation panel on the Smart Portfolio tool. Under this tab, you can see your portfolio’s Asset Allocation, which is the contribution of each type of asset class to the total portfolio holdings. This information is displayed in the form of a pie chart for easy understanding. The information is available under three heads: My Assets (asset class), My Top Stocks (highest to lowest securities), and My Geo Allocation (as per geographical location).   

Next, you can see the Stock Distribution for your portfolio. This information is also available on the basis of different criteria, including By Sector, By Market Cap, By Dividend, By Beta, and BY P/E Ratio (price/earnings per share). Here, you can carefully study whether your portfolio is diversified well enough to align with your current investment objectives. For instance, a portfolio with zero exposure to cash and high exposure to cryptocurrencies could be highly risky. You may want to reconsider this allocation and allot higher proportions to safer, liquid assets. 

Through the TipRanks Smart Portfolio tool, you can also study the Portfolio Volatility (beta) vis-à-vis the average volatility of portfolios created on the TipRanks platform. The table will display the My Highest Risk Stocks list, showing stocks in your portfolio that carry a high beta. 

Moreover, you can analyze your Portfolio’s P/E compared to the average P/E of portfolios created on the TipRanks platform. You will also see a list of My Highest P/E Ratio Stocks to enable you to carefully study whether including these stocks in your portfolio is worthwhile or not.  

At the bottom of the page, you can see your Portfolio Dividends and Stock Warnings (if any). The dividend information will tell you the Estimated Annual Dividend Yield of your portfolio along with a list of My Top Dividend Stocks and related Yields. Similarly, you can see the Estimated Annual Dividend Payment (dollar terms) along with a list of Upcoming Dividends and Ex-Dividend Dates for your stocks. Meanwhile, stock warnings will tell you if any of your stocks have received a negative signal from any of the experts. These could include Sell ratings by Wall Street analysts or Sell transactions by corporate insiders or hedge fund managers. By studying these warnings, you can dive deeper into the reason for the sell views and reconsider your stock-holding decision.  

 How Individual Investors are Ranked in Smart Portfolio

If you have been using the TipRanks’ Smart Portfolio tool regularly, you will be aware that just as we rank the Experts, we also rank your individual portfolios. An investor’s portfolio ranking is available on the My Performance page under Portfolio. Isn’t it exciting to see how your portfolio is ranking in comparison to the portfolios of other TipRanks investors? Well, let’s just learn how we do it. 

There are two ways that TipRanks measures the performance of your Smart Portfolio. 

Validated Performance (Recorded by TipRanks) 

Validated performance is an objective measure of your portfolio activity. It is also the system we use to rank individual investors. 

Validated performance is based on the objective performance of the stocks you add to, or remove from, your portfolio. We measure performance using the end-of-day price (EOD) for the stocks you have traded on the day your transaction was recorded. If a transaction is entered after the stock market has closed, Smart Portfolio will measure the EOD price of the stock on the following day. 

Validated performance does not incorporate the number of shares you add, rather it measures all transactions on an equal weight basis. This means that you can see your validated performance even if you haven’t specified the number of shares. As validated performance is based on EOD prices, it can take time to update. 

Reported Performance (Reported by User) 

Reported performance is a subjective measure of your portfolio activity and is based on values you edit in your portfolio, specifically purchase price. This feature enables you to see how your portfolio performs according to how you manage it day-to-day, which is why you have the flexibility to edit the transaction date & execution price. As the reported performance cannot be validated by TipRanks, it is not used for ranking investors. To see your reported performance, you must enter the number of shares of your holdings. 

How Your Performance is Ranked 

When you look at your validated performance on Smart Portfolio, you will see your star ranking and how you place compared to approximately half a million investors with a Smart Portfolio. We employ a 3-step rating system as follows to rank the investors, just as we do in the TipRanks Star Ranking System. 

  • Average return – the average return of each of your recorded transactions 
  • Success rate – the percentage of your transactions that have yielded a positive return 
  • Statistical Significance – the higher the number of transactions, the more statistically significant your performance. Therefore, an investor with many transactions is more likely to have a high star ranking if they have a good average return and success rate. On the other hand, an investor with many transactions and a poor average return and success rate is likely to have a low star ranking. 

How to Use the “Performance” Tab  for Your TipRanks Portfolio

So far, you have learned about the nitty-gritty of creating a TipRanks Smart Portfolio and also understood how we rank your Portfolio. Now, it is time to see how your portfolio performance stands as compared to a few benchmarks and other investor portfolios on TipRanks. To navigate to this page, go to Portfolio (main menu) – My performance.  

The Performance page displays your own Success Rate of profitable transactions, and the Average Return earned per transaction. Plus, you can see the Portfolio Gain/Loss (%) in terms of the past 1 Month Return, 6 Month Returns, 12 Month Returns, YTD Returns, and Total Returns (from the day the portfolio was created). Also, you can see all the basic information related to your Portfolio Details such as Active Since, Risk Profile, No. of Trades undertaken, and Est. Dividend Yield. Finally, you can see your Most Profitable Trade to date, including the asset name, the date when the trade was Opened and Closed, as well as the Gain on trade.  

Furthermore, as discussed in the previous section, you can see your portfolio ranking under two options as follows: 

Activity Recorded by TipRanks – under this, performance is based on the end-of-day stock price when you add a holding to your portfolio and cannot be edited. Your portfolio performance is ranked according to this objective measurement. 

Activity Reported by Me – This section, which was requested by TipRanks users (not available for portfolios that are synced to a brokerage account) contains the data that you can edit. Having the two different performance models gives you the flexibility to edit your holdings, while we maintain an objective way to measure rankings. 

In both cases, you can see how your portfolio performance compares to the TipRanks Average portfolio, the TipRanks Best (top-performing) portfolios, and the S&P 500 (SPX) for various historical months. You can also change how the chart appears when comparing your portfolio returns to the SPX (between the bar chart and line graph). 

Measuring your portfolio performance on a stand-alone as well as comparative basis is one of the most important tasks during portfolio analysis, as it helps you understand whether your investments are generating enough returns or not. Based on the study, you can decide if you need to reshuffle your portfolio to include higher-income earning assets and discard lower-income or loss-making assets from your portfolio.  

And lastly, you can track the Recent Activity of each security in your portfolio in a tabular format. The table shows the Company Name, % of Portfolio exposure, Return earned, No. of Transactions, Last Transaction detail (open/buy/close), and Date of Transaction. This step will also help you to follow your recent transactions and understand which of your allocations are underperforming, and then make appropriate rebalancing decisions.

How to Use the “Charts” Feature to Improve Your Portfolio’s Performance

The Charts feature on the Smart Portfolio page is similar to the Chart tool on a stock’s page. On this page, you can undertake a thorough technical analysis of the stocks in your portfolio or on your watchlist. On the right-side corner of the page, you can select the stock (from a list of your portfolio of stocks or watchlist) for which you want to undertake the study. The technical analysis will help you understand the right time to enter or exit a stock. By studying the past behavior of a stock’s price and volume, you can predict the future performance of a stock’s price. What’s more, past behavior forms a pattern for the stock’s future movement that can be used to decide if the stock is moving towards the bullish trend or the bearish trend.  

On the Charts page, you can study various Moving Averages or Oscillators that will help you decide the timing of the stock trade. We can learn about using the technical indicators in our investment strategy with the help of the example of iPhone maker Apple (NASDAQ:AAPL). Below is the screenshot of Apple’s stock chart plotted along with the technical indicators, namely 50-Day EMA (exponential moving average), 20-Day EMA (exponential moving average), RSI (Relative Strength Index), and Pivot Points. 

The technical analysis study shows that AAPL stock is poised for further upward movement. Its 50-Day EMA is 170.77, while its last closing price is $188.06, implying a bullish signal. Further, its shorter-duration EMA (20 days) also signals an uptrend.  

Additionally, Apple’s RSI at 71 does not signal an overbought condition (an RSI above 80 means overbought, and below 20 means oversold). At the same time, while Apple stock is in an uptrend, it could face immediate resistance at $186 (based on Pivot Points).  

By studying these factors and several more that are available on TipRanks’ Technical Analysis page, you can make an informative and timely decision to enter or exit a stock at the given price. 

How to Make Your Smart Portfolio Public or Private

Are you proud of your portfolio performance and do you want to share your success with other investors? Here’s how you can make your portfolio public or private on TipRanks Smart Portfolio.  

Go to the Public Portfolio tool on the left navigation panel on the Smart Portfolio page. Here you can see the many benefits TipRanks gives, and the discretion that TipRanks follows, while sharing your portfolio with other investors. 

For instance, your investments are shown only in percentages; the cash and dollar value of your investments remain private. Similarly, in case you change your mind, you can take down your public profile page at any time. Interested? Follow these simple steps: 

  • Enter your Full Name in the space provided 
  • Choose the Portfolio which you want to make Public 
  • Describe your portfolio in a few simple words (not compulsory) 
  • Agree to the TipRanks Terms of Use 
  • And click on Go Public! Voila, your portfolio is now Public, and your success story is shared with thousands of TipRanks investors 

Once your portfolio becomes public, you can choose between Public Portfolio and Only Me options under Who can see my portfolio. When you select Only Me, your public portfolio becomes private again. It’s that easy! 

How to toggle between Your Performance Reported by You and Your Performance Recorded by TipRanks

TipRanks displays your portfolio performance in two ways: Activity Recorded by TipRanks and Activity Reported by Me (investor). You can choose to see your performance either way by switching between the two options on the top left of the Performance page.  

There is a slight difference between both types of reporting, as follows: 

Activity Recorded by TipRanks – Under this, performance is based on the end-of-day stock price when you add a holding to your portfolio and cannot be edited. Your portfolio performance is ranked according to this objective measurement. 

This type of performance is also called Validated performance. This performance does not incorporate the number of shares you add, rather it measures all transactions on an equal weight basis. This means that you can see your validated performance even if you haven’t specified the number of shares. As validated performance is based on EOD prices, it can take time to update. 

Activity Reported by Me – This is the data that you can edit. This was requested by TipRanks users, and by creating two different performance models, you have the flexibility to edit your holdings, while we maintain an objective way to measure ranking. 

This type of performance is also called Reported performance, which is a subjective measure of your portfolio activity and is based on values you edit in your portfolio, specifically the purchase price. This feature enables you to see how your portfolio performs according to how you manage it day-to-day, which is why you have the flexibility to edit the transaction date & execution price. As the reported performance cannot be validated by TipRanks, it is not used for ranking investors. To see your reported performance, you must enter the number of shares of your holdings. 

In both cases, you can see how your portfolio performance compares to the TipRanks Average portfolio, the TipRanks Best (top-performing) portfolios, and the S&P 500 (SPX) for various historical months. You can also change how the chart appears when comparing your portfolio returns to the SPX (between the bar chart and line graph). 

 How to Use the “Crowd Insights” Tab on Smart Portfolio

Crowd Insights is where you can see how your portfolio compares to other investors’ portfolios (Average Portfolio), and if you have a Premium account, where you can compare your portfolio to the Top-Performing Portfolios. 

On this page, you can study your overall Asset Allocation vis-à-vis that of the Average Portfolio created on TipRanks. You can toggle between the asset allocation by Sector (Consumer Goods/Financial/Technology), by Assets (stocks/ETFs/crypto/cash), or by Market Cap (Mega/Large/Medium/Small). This study will help you understand other investors’ current inclination toward sectors and might urge you to think along the same lines. 

Further below, you can view the Key Statistics such as Dividend Yield, Risk (Beta), and P/E ratio of your portfolio as compared to the Average TipRanks Portfolio. 

 You can also see your dividend yield, beta, and P/E ratio and compare them to those of average TipRanks portfolios. This comparison will help you understand if your portfolio provides reasonable dividend yields or if the beta of some of the stocks in your portfolio is too high/risky. Plus, you can compare if the P/E of your stocks is higher than the rest, implying that your stocks are too pricey at the moment.  

Lastly, you will see a list of the Major Holdings in descending order of contribution under My Portfolio as compared to the Average Portfolio. And you can also see the sector-wise breakdown of the major holdings in both portfolios.  

An additional feature, Recent Trades by TipRanks Investors, shows you the recent trades of TipRanks investors. The list will show you the stocks Recently Added and Recently Removed by TipRanks Investors. As mentioned before, this study will help you understand other investors’ current inclination toward sectors/stocks/asset classes and might urge you to think along the same lines. 

How to View Other Investors’ Smart Portfolios 

It can be useful to investors to see the portfolios of other individual investors on TipRanks. You can easily find out which assets are in the portfolios of other investors who hold Smart Portfolios, and further research those assets to determine whether they are worth buying. 

There are two ways to view other users’ portfolios: via the Top Individual Investor page, and via the Crowd Wisdom tab on individual stock pages.  

On the Top Individual Investor page, click on any investor’s name to be brought to a detailed view of their portfolios.

On the Crowd Wisdom page, click on any investor’s name to be brought to a detailed view of their portfolios.


Calendars

How to Use the Dividend Calendar to Track Upcoming Dividend Payments on Your Stocks

For an income-savvy investor, dividend stocks are some of the best bets. Dividends are paid either monthly, quarterly, semi-annually, or annually, from the surplus cash held by a company. The amount and timing of dividend payments are decided upon by a company’s board of directors.  

To keep you updated on the upcoming dividend payments for your stocks, TipRanks created the Dividend Calendar, which tracks the relevant dividend information presented in publicly available documents of all listed companies. By visiting the dividend calendar regularly, you will know exactly when to expect to receive your next dividend payment. The dividend calendar can also be a useful stock research tool, as many investors choose stocks based on their upcoming dividend distributions. 

To navigate to the page, go to Stock Ideas – Calendars – Dividend Calendar, or you can go to Dividends – Dividend Calendar. On the page, you will find a Date-wise list of companies in alphabetical order for which the dividends are due, starting the same day. You can also input the Stock Ticker or Company Name to quickly go to the stock’s Dividend information page. 

In the dividend table, you will see the Company Name, the Ex-Dividend Date of the upcoming dividend, the Payment Date for the same, the Dividend Amount per share, the current Dividend Yield, Analyst Consensus on the stock, and the Analyst Price Target on the stock. Through the TipRanks Dividend Calendar, you can also see the historical ex-dividend dates for stocks by choosing the month and date, and you can also move forward from the current date to see the forthcoming ex-dividend dates for stocks.  

That’s not all – you can also select the set of companies for which you want to view the dividend information. From the panel on the left side, you can select the Market Cap of the companies (Mega, Large, Medium, Small, and Micro). Similarly, you can select the Sector of companies from the list of available sectors. And finally, you can select the Analyst Consensus on stocks for which you want to see the dividend information. As with all TipRanks tools, you can choose the Geography for which you wish to see the data.  

How to Use the IPO Calendar to Track Upcoming IPOs (Initial Public Offerings)

Initial public offerings (IPO) are a great way to earn solid stock price appreciation. Investors often look for good value IPO stocks to gain an edge in a stock that is poised for substantial growth in the future. TipRanks accumulates the data of all upcoming IPOs of companies from publicly available documents.  

To navigate to the page, go to Stock Ideas – Calendars – IPO Calendar. On the page, you will find data for both already Priced and Upcoming IPO information in tabular format. The table displays the Company Name (which is going public), the Ticker symbol under which the company will be listed, the Market Index (NYSE, NASDAQ) on which the company will be listed, the listing Price per share, the number of Shares offered in the IPO, and the Date of listing.  

All the relevant information related to the IPO is available on this page. By reviewing the IPO Calendar regularly, you can stay updated with all the latest and upcoming IPO news and select the best company to invest in. Plus, as with all TipRanks tools, you can choose the Geography for which you wish to see the data. 

How to Use the Earnings Calendar to Track Upcoming Earnings Announcements

Are you ready with the earnings data for your portfolio of stocks when the Earnings Season approaches? It is pertinent to know about the earnings expectations of a stock, so you can take appropriate trading decisions. TipRanks accumulates the earnings information of listed stocks from publicly available documents and makes it easier for you to track your stock’s earnings data. 

To navigate to the page, go to Stock Ideas – Calendars – Earnings Calendar. On the page, you will find a Date-wise list of companies in alphabetical order for which the earnings are due, starting the same day. You can also input the Stock Ticker or Company Name to quickly go to the stock’s Earnings information page. 

In the Earnings table, you will see the Company Name, the Report Date of the upcoming results, the Period Ending for the quarter, the Consensus EPS Forecast for the upcoming quarter, Last Year’s EPS for better comparison, the Analyst Consensus for the stock, and the Analyst Price Target on the stock. Through the TipRanks Earnings Calendar, you can also see the historical earnings dates for stocks by choosing the month and date, and you can also move forward from the current date to see the forthcoming earnings dates for stocks.  

That’s not all – you can also select the set of companies for which you want to view the earnings information. From the panel on the left, you can select the Market Cap of the companies (Mega, Large, Medium, Small, and Micro). Similarly, you can select the Sector of companies from the list of available sectors. And finally, you can select the Analyst Consensus on stocks for which you want to see the dividend information. As with all TipRanks tools, you can choose the Geography for which you wish to see the data.  

Remaining knowledgeable about the upcoming earnings dates, along with Wall Street analysts’ expectations and price targets, will help you decide which stocks you want to buy/hold/sell in your portfolio and maximize your portfolio returns.  

The Earnings Calendar can also be a useful stock research tool, as many investors choose stocks based on their upcoming earnings dates. For instance, upon scanning the Earnings Calendar, suppose you realize that big box retailer Walmart (NYSE:WMT) is set to release its quarterly results after a week. From the earnings data table, suppose you also see that the Consensus EPS Forecast for WMT is higher than Last Year’s EPS. Plus, you see that the Analyst Consensus is a Strong Buy and that the Price Target has a decent upside potential from the current share price.  

An investor might decide that, from these brief points, WMT stock seems like a good bet to make before earnings, with decent share price appreciation.  

Having said that, it’s still important to go to the stock’s page and see whether, historically, the company has beaten/missed analyst expectations. In addition, it’s helpful to read all relevant news pieces and Analyst viewpoints to see how the sentiment around the stock has been. After studying all these factors, you can be more confident in your decision about whether to invest in a particular stock.  


Earnings

How to Use TipRanks’ Earnings History Tables in Your Investment Strategy

A stock’s earnings (EPS or earnings per share) results play a very important role in the stock’s performance. Wall Street analysts build in-depth financial models for companies and project revenue and earnings for said companies, quarterly. Each time a company reports its quarterly results, they are compared with the analyst expectations, and the stock price usually fluctuates in tandem. Consistent earnings beats vis-à-vis the analysts’ estimates tend to push the stock upwards, while earnings misses pressurize the stock down. 

To understand how the company has performed historically regarding its earnings, TipRanks has built a dedicated Earnings page. To navigate to the page, go to the stock page that you are studying. On the left panel bar, go to Earnings. On the top, you will see the Earnings Data table, which shows you the next quarterly earnings Report Date, the Period Ending for the quarter, the analysts’ Consensus EPS Forecast for the quarter, Last Year’s EPS figure for comparison, and the TipRanks Analyst Consensus (Buy/Hold/Sell) for the same. 

Below the table, you will find the stock’s Earnings, Revenues Date & History Chart. On this bar chart, there are two main tabs: Earnings and Revenues. On the Earnings tab, you will find the historical Estimated EPS (colored dark green) figures vis-à-vis the Reported EPS (colored light green) figures. The table gives you the actual data for the last eight quarters already reported, and the EPS estimates for the upcoming quarter. Please note, the upcoming earnings date is often based on the dates of a company’s previous reporting and may be updated when the actual date is announced. The bar chart makes it easy to understand how many times the stock has outpaced or missed its earnings expectations in the past quarters.  

On the Revenues tab, you will see a chart presenting the actual revenue (colored dark green) and earnings (colored light green) performance for the past nine quarters. By looking at the trend in both metrics, you can learn whether the company has improved or worsened its performance over time.  

Next comes the stock’s Earnings History table. This again gives you the same earnings Beat (green color) or Missed (red color) data in a tabular format. The table shows the quarterly Report Date, Fiscal Quarter for the report, Forecast/Actual EPS figures, Last Year’s EPS figure for better comparison, EPS YOY Change (in both % and actual terms), and a link to the Press Release of the earnings. This table displays the historical data for the past nine quarters plus the estimated data for the upcoming quarter. You can click on Show More to see historical data up to 2018 (wherever available).   

By studying all these data sets, you can dive deeper into the reasons why the company may have missed estimates earlier and what the company is doing to improve future performance. This study will help you to make an appropriate buy/hold/sell decision on the stock.  

Let’s understand the importance of studying the Earnings page with the help of an example: 

During the COVID-19 pandemic, most technology stocks reported significantly improved earnings and revenue numbers due to increased use of technology, which pushed the stock prices higher. However, as the pandemic faded, the demand for tech-related products diminished, pressurizing companies to engage in higher layoffs and cost-cutting measures, which effectively dragged down their share prices. If you compare the earnings and revenue trends for these stocks in the past and current quarters, you will see a decline. That implies that the stocks had to undertake massive hits to bottom lines and sales expectations. Analysts across the sector have revised their earnings expectations on tech stocks to keep in line with the subdued demand. Such an in-depth study of a stock’s earnings and revenue trends can assist you in making an apt investment decision.   

How to Use TipRanks’ “Earnings-Related Price Changes” Tables in Your Investment Strategy

Now that you are aware of the importance of a stock’s earnings beat or miss, next up is understanding how that impacts the stock’s price. TipRanks helps by consolidating the data of the price movement of the stock both before and after the earnings release to see how it impacts the stock.  

On the Earnings page of stock, you will find the Earnings-Related Price Changes table at the bottom of the page. This table displays the earnings Report Date, the stock’s Closing Price Before the Earnings, the stock’s Price After the Earnings, and the Percentage Change between the two prices. The table shows historical data from up to 2020 (wherever available). By studying this data, you can gauge how much a stock’s price has moved immediately after an earnings beat/miss, and this information can help you to make appropriate trading calls during the earnings season. Many investors view the earnings seasons as a suitable time to buy or sell stocks, and the TipRanks Earnings Related Price Changes table can be extremely helpful in making these decisions.    

Let’s understand this table with the help of an example. Below is a screenshot of tech giant Microsoft’s (NASDAQ:MSFT) Earnings-Related Price Changes table.  

Please note: If earnings are announced before the market opens on a particular day, we show the initial closing price of the day before and the closing price of the day the results are announced. Meanwhile, if earnings are announced after the market close on a particular day, we show the closing price of the same day as that of the earnings date, and then the closing price of the following day.  

MSFT posted its earnings results on April 25, 2023 (after the market close). The closing price of MSFT on the day of the earnings release, April 25, was $274.82. The closing price after the earnings beat rose to $294.72 on April 26. The percentage change between the price on April 25 and April 26 is 7.24%. Many investors would thus choose to follow an investment strategy based on this historical figure: the opportunity to earn a similar short-term price appreciation on the stock. Reviewing a stock’s historical price changes immediately after earnings can help investors shape their investment strategies.  On this chart, you can see the % price changes for the other earnings dates as well.  

It is important to note that the price changes, post-earnings, do not fully depend only on the earnings beat. The revenue beat is also important and so is the outlook that the management provides in the earnings release. Plus, any kind of other information like dividends or share buybacks can affect a share price. Based on your study of the stock’s past price performance related to earnings, you can decide how to make trading calls during the earnings season.  


Risk Analysis

How to Use TipRanks’ Risk Charts and Graphs in Your Investment Strategy

While studying a company’s fundamentals, it is essential to look at the risks associated with the stock. Investors often ignore this very important aspect when making an investment decision. A stock’s risks can fall into several categories, such as company-specific or industry-specific, as well as those related to the country-specific macroeconomic factors in which the company conducts business. These risks are listed in the quarterly and annual regulatory filings (10Q/10K), which publicly listed companies are required to submit to the Securities and Exchange Commission (SEC).  

For an investor, it is both tedious and difficult to go through the “Risk Factors” section of the SEC filings. Don’t worry, TipRanks has a solution for the problem. Our artificial intelligence (AI)-designed mechanism scans all publicly available documents to extract the risk factors and displays them under one simple tool – Risk Analysis. To navigate to this page, go to the stock page that you are studying. On the left panel bar, go to Stock Analysis. Scroll down the page and you will find the Risk Analysis tool. Click on Detailed Risk Analysis to study about the company’s risk factors. On this page, you will find several risk-related charts including Risk Overview, Risk Change Over Time, Risk Highlights, and Risk Factors Full Breakdown. 

Risk Overview – This graph shows the Risk Distribution for the latest reported quarter. TipRanks breaks down the risk into six broad categories. These risk categories include Legal & Regulatory, Ability to Sell, Production, Macro & Political, Finance & Corporate, and Tech & Innovation. From the breakdown of the risks, you can gauge which risk is the most sensitive for the stock. These risks will be largely driven by the company’s nature of business. For instance, for a consumer goods company or a retailer, risks related to the Ability to Sell may be the most significant, along with the Production risks. Meanwhile, for a financial institution, the Finance & Corporate risks could loom largest.  

Alongside the Risk Overview, you will find a bar graph showing the risk distribution as compared to the Sector Average. The graph shows if the stock’s risk is Higher or Lower compared to the sector average. This enables you to understand if a stock is more prone to a specific risk compared to its peers and allows you to make an apt investment decision. 

As you scroll down the page, you will see the Risk Change Over Time graph, which shows the quarterly risk disclosure for the stock. This chart shows the number of risks a company has disclosed in the various quarters. At a glance, you can see how many risks were removed, added, or changed over the past several quarters. Below the chart, you will also see the details of the risks newly added, changed, or removed in the chosen quarter. These details are sourced directly from the quarterly/annual SEC filings of the company.  

Further down on the page, you will see a section of Risk Highlights, which briefly shows the Main Risk Category in the latest quarter, the Number of Disclosed Risks, Recent Changes in Risks, and the Number of Risks Changed in the quarter. Adjacent to this information, you will find the Risk Word Cloud, which displays the most commonly used phrases about risk factors from the most recent report. Larger texts indicate more widely used phrases.    

And finally, at the bottom of the page, you will see a table of the Risk Factors Full Breakdown, according to the category and subcategory. The list starts with the category in which the company holds the highest risk. Click on sub-categories to read relevant extracts from the most recent report. The table also displays the percentage of each type of risk’s contribution to total risks as well as whether the extent of risk is Below/Above Sector Average. 

How to Understand TipRanks’ “Risk Change Over Time” Chart

Now that you are aware of the importance of studying a stock’s risk factors, it is time to introduce one of TipRanks’ unique charts, the Risk Change Over Time. The chart shows the change in the quarterly risk disclosures for the company, along with the number of risks the company has disclosed in the various quarters. From a dropdown bar, you can choose for which Fiscal year and quarter you wish to see the data. When you hover over the line graph for a particular quarter, you will see the Report Type from which the information was sourced, the date when the filing was Reported, and the Period Ending, which tells you which quarter the chart refers to. Additionally, you will see the Total Risks Disclosed, newer Risks Added (maroon), the number of Risks Removed (green), and the number of Risks Changed (yellow). The trend in the graph can also help you understand if the stock’s risks are increasing or decreasing. 

To further understand the nature of risks that changed in the quarter, you can study the details given right below the graph. The word section gives in detail the risks added, removed, or changed during the quarter. When you click on any of the subsections, you can read the detailed paragraphs on Risk Factors from the relevant regulatory filings.   

Interestingly, for the Risks Changed subsection, you also have the option to see the Old Text, and New Text of the associated risks, as well as See Changes between both the old and new risk details highlighted in green.  

For instance, Apple added a few more factors to its Production risk in the third quarter of Fiscal 2022. In the Q2FY23 filing, Apple stated the section as follows: The Company’s success depends largely on the continued service and availability of highly skilled employees, including key personnel. 

But in the Q3FY23 filing, Apple added a few more factors (in green) to the same risk, as follows:  

The Company’s success depends largely on the talents and efforts of its team members, the continued service and availability of highly skilled employees, including key personnel, and the Company’s ability to nurture its distinctive and inclusive culture. 

Similarly, in Tesla’s (NASDAQ:TSLA) Q4FY22 filing, the company changed a few words (words canceled indicated in red color) and replaced them with new words (words added indicated in green color) under its Production risk, as follows: 

We may experience issues with lithium-ion cells or other components manufactured at Gigafactory our Nevada and Gigafactory Shanghai Gigafactories, which may harm the production and profitability of our vehicle and energy storage products. 

By reading the Risks Changed Over Time section, you can analyze how a stock’s risks are changing along with modifications in the company’s business operations, legal environment, or macro factors. An in-depth study of the changing risk factors allows you to make appropriate buy/sell calls on the stock.   


News Score

How to Use TipRanks’ News Score in Your Investment Strategy

One of the most important things to do once you create your portfolio is to remain updated about the latest happenings of the companies whose stocks you hold. TipRanks’ News and Insights section helps you to do just that. What’s more, TipRanks calculates a News Score based on the news articles related to a stock. By placing the news element in an easy-to-read data format, TipRanks helps you to quickly gauge the sentiment surrounding the stock and use it to your advantage. 

To navigate to this page, go to the stock page that you are studying. On the left panel bar, go to News & Insights. Along with the News Score, you will find the headlines of all the latest news on a stock from popular news publications. You can click on any news article to read it further. Additionally, TipRanks will tell you whether the sentiment on the news is Bullish/Neutral/Bearish by displaying a button near the headline for each news story.  

The TipRanks News Score helps you to see how Bullish or Bearish a stock is based on its recent media coverage. This score is generated using a formula that combines Media Buzz and News Sentiment. The combined signal will be one of the following: Very Positive/Positive/Neutral/Negative/Very Negative.  

Media Buzz – This measures the number of stock-related articles published during the current week as compared to an average week. If the number of articles in the current week is higher than the weekly average number, it trends toward a bullish sentiment, and the quantity of excess will decide the degree of bullishness (trending toward darker green). The opposite applies when the number of articles in the current week is lower than the weekly average, indicating bearishness. Media Buzz is shown in a simple chart, which includes the number of articles This Week vis-à-vis the Weekly Average on a trend line, with green showing bullishness and grey showing bearishness.  

News Sentiment – This measures the percentage of Bullish/Bearish articles on the stock as compared to the sector average. News Sentiment is shown in a simple chart, which includes the number of bullish/bearish articles This Week vis-à-vis the Sector Average on a trend line, with green showing bullishness and pink showing bearishness.  

News Score – The combined result of both the above factors is displayed as the News Score. The more positive the News Score, the better, as it means the stock is poised for an upward trajectory, and vice versa when the score is negative. Once you have gauged the News Score of the stock, you can browse the Bullish and Bearish news related to the stock right beside the chart. Scan through the news pieces and read through those that interest you. You will gain a clearer picture of why the media is bullish or bearish on a stock and form your investment decisions accordingly.  

How to Understand the Difference between Media Buzz and News Sentiment

The TipRanks News Score includes two elements: Media Buzz and News Sentiment. The media buzz measures the number of stock-related articles published during the current week as compared to an average week. On the other hand, the News Sentiment measures the percentage of Bullish/Bearish articles about the stock as compared to the sector average. In short, the Media Buzz defines the quantity of news pieces, while the News Sentiment defines the quality of the news pieces, meaning what type of sentiment they express on the stock. Both sets of information are necessary to make accurate and timely investment decisions.  

If a stock has been buzzing lately, and several media outlets are publishing articles on the stock, it usually means there is some important event relating to the stock. At the same time, it is also important to understand the nature of the media buzz, i.e., the news sentiment. Why are the publications reporting news on the stock? Is it because of some positive or negative development? It’s important to study both of these aspects to derive your buy/sell call on a stock. TipRanks presents both types of information to you in easy-to-understand graphs, smoothing out your investment journey.  

How to Use the Media Coverage Analysis Graph in Your Investment Strategy

Now that you have understood the difference and importance of studying both the Media Buzz and News Sentiment of a stock, let us see what other news-related information TipRanks has to offer. The TipRanks Media Coverage Analysis Graph presents the historical news coverage of the stock for the last three months. You will find this graph below the News Score on the News & Insights Page of a stock.   

The graph displays three important aspects: the Number of Articles published during the period, the related Price Movement, and the breakdown of Bullish/Neutral/Bearish Articles in the same time frame.  

During certain periods such as the earnings season, there will be a higher number of articles on a stock, each covering the earnings expectations or results for the company. If you notice, the price movement will fluctuate more before earnings are released, as more investors take trading calls based on their research. The same holds true when a company announces a major restructuring or company-level event that may have a positive or negative impact on the stock.  

From the historical trend of the news and the price movement, you can gauge how popular a stock is and how the stock prices may fluctuate in the future based on some events. As an investor, this information helps you to make appropriate trading calls on the stock and prepare for any future stock volatility.  


Crowd Wisdom

How to Use the Crowd Wisdom Tab to Improve Your Investing 

You will find the Crowd Wisdom tab in the side navigation menu for each individual stock. Use this page as part of your investment research to find out what investors overall think about a stock. This page is also useful as a gateway to opening and viewing individual investors’ portfolios, giving you new investment ideas.  

You can toggle between a view of All Investors who hold portfolios on TipRanks, and Top Investors, who have been highly ranked by TipRanks.  

The Average Holdings Size chart shows you, on average, what percentage of portfolios are allocated to that stock.  

The Portfolios Holding [Stock Name] shows you the percentage change in the number of portfolios holding that stock, in both the Last 7 Days and the Last 30 Days.  

Next, the Investor Sentiment chart displays a pie chart indicating the amount of the stock bought and sold by individual investors in the recent quarter. It also tells you whether the overall sentiment of investors holding the stock is Positive, Neutral or Negative.  

Below that, you will see a table of [stock name] Investor Activity. Filter according to Action (Closed, Increased, Reduced or Opened). You can also filter the chart according to the star ranking of investors holding the stock. The table shows all transactions made on the stock by individual investors in the past six months. For each transaction made, you will see the Investor Profile, the Investor Action taken on the stock, the Transaction Date, the Portfolio Allocation in percentage form, and the Execution Price. The final column gives you the option to Follow each individual investor.  

Click on any individual investor’s name to see a full profile of their portfolio and its holdings.  

Beneath that chart, you will find a table called [Stock Name] Investors Also Bought. You can filter this chart by All Investors, Investors Under 35, Investors Between 35-55, Investors Over 55, and Best Performing investors. This chart shows you other stocks bought by the investors who purchased the stock under discussion. On this chart, you will see the Name of the stock, the Average Holding Size of the stock in all Smart Portfolios, the Last 7D Change (percentage by which the holdings changed in all portfolios in the past seven days), and the Last 30D Change (percentage by which the holdings changed in all portfolios in the past thirty days). The next column shows the Market Cap of each stock listed in the chart. The following column displays the Sector the stock is in, and the final column gives an option to Follow the stock.  

As you scroll down the page, the next chart shows you a [Stock Name] Investor Analysis. Here, you can see the investment trends and performance of individual investors in that stock who are Under 35, Between 35-55, and Over 55. For each age group, you will see the Last 30 Days Holding Change of that stock, and the percentage of holders of that stock who are in that age group. You will also see the Average Segment Performance of that age group on the stock, displayed in the form of Average P/E Ratio, Beta, and Dividend Yield.  

Scrolling further down the page, you will find a list of FAQs and their answers. Finally, you will see a chart indicating the Stocks with the Most Positive Individual Investor Sentiment in the [xxxxx] sector, which displays the tickers and prices of a few stocks that are in the same sector as the stock whose data you are viewing.  


The Top Individual Investors page and the Crowd Wisdom tool help you invest wisely. Use them to view and follow the data about other investors’ transactions to learn new investment ideas and determine where best to place your money. 

Technical Analysis

How to Use the Technical Analysis Tool to Assess a Stock’s Price Movement

Have you decided which stock you want to buy after thoroughly understanding its financials and valuations? Well, that is just one part of the game. The second part involves the timing of the stock purchase: When is the right time to buy the stock? 

One way of determining the timing of the stock purchase is to study the technical indicators of a stock. To address the issue, TipRanks’ recently launched the All-In-One Technical Analysis tool, which offers a variety of technical indicators to help you make better-informed investment decisions. To navigate to the new Technical Analysis page, simply go to any stock page you wish to study, and you will see it in the menu on the left side of the page. 

Technical Analysis is a method of evaluating securities by analyzing statistics generated by market activity, such as the stock’s past prices and volume momentum. This type of analysis is often used by traders and investors to identify trends, predict stock movement, and make informed investment decisions. 

Once you have landed on the Technical Analysis page, you will see a Summary of All Indicators along with a chart. The default reading of the technical indicators will be for 1 Day. You can change the reading for a different period ranging from 1 Minute to 1 Month. Plus, the technical analysis page displays three different signals: Summary, Oscillators, and Moving Averages, each for a choice of time frames. 

Oscillators are usually used by traders to determine if a stock is overbought or oversold. An overbought stock could mean that the stock’s price may be headed for a downward trajectory and a time to exit/sell (or not buy the stock). Conversely, an oversold stock may mean that the stock is poised for an upward trajectory, and this might be the right time to enter the stock, if supported by the fundamental study. 

Traders use multiple oscillators to arrive at their buy/sell decision and to confirm the price ranges of stock. TipRanks uses the Relative Strength Index (RSI) and the Stochastic Oscillator as some of the important metrics in its calculations. Both RSI and Stochastic oscillators are momentum oscillators used to study the price movements of a stock. The RSI is a technical indicator that works by measuring the speed and volume of the price movement of a stock. The stochastic oscillator compares the position of the most recent closing price of a stock with its highest and lowest trading prices during a given time frame. 

Moving Averages provide insight into the trend of the security by smoothing out its price data and highlighting the overall direction of the trend. For example, a stock’s 50-day moving average shows the average price over the past 50 days, which can help identify a bullish or bearish trend. A bullish trend means the stock’s price is moving upwards, while a bearish trend means the price is moving downwards. 

The Summary provides a combined picture of the Oscillators and Moving Averages of the stock, as calculated by TipRanks.  

For each of the three indicators in the chart, you will see a Buy, Sell, Strong Buy or Strong Sell, or Neutral Signal. TipRanks calculates the signals based on the total number of Bearish, Neutral, and Bullish signals. By looking at the individual signals and the Summary Signal, you can decide if it is the right time to enter the stock. The Summary Signal takes into account both the Oscillators signal and the Moving Averages signal.  

Furthermore, below the chart, you will see details about a few indicators and what they suggest. These include the stock’s Moving Averages Convergence Divergence (MACD) indicator, 20-Day exponential moving average, and its 50-Day exponential moving average. For instance, if the exponential moving average is below the current stock price of the company, it could suggest a Buy.   

Further below, you will see the Pivot Points of the stock. Pivot Points help identify key Support (S1, S2, and S3) and Resistance (R1, R2, and R3) levels by calculating the average of a stock’s high, low, and close prices. These levels also can be used to determine when to enter or exit a trade. These points are available for both the Classic and Fibonacci figures.   

Further down on the page, you will find a table showing the different Moving Averages numbers including MA5, MA10 up to MA200. Plus, another table displays the Value and Action calculated by the different Technical Indicators. These include the RSI (14), STOCH (9,6), MACD (12,26), Williams %R, Ultimate Oscillator, etc.  

To sum it up, all these different indicators and the signals generated by each help you to identify the correct timing to buy or sell a stock. By combining the technical indicator signals with the fundamental research tools, you can decide which stock should be added or removed from your portfolio to maximize returns.  

How to Use the Technical Analysis Tool in Your Investment Strategy

While studying the fundamentals of a stock is important to understand if the stock is worth investing in, the technical analysis tools help you to decide the right time to enter or exit the stock. By studying the past behavior of a stock’s price and volume, you can predict the future performance of a stock’s price. What’s more, past behavior forms a pattern for the stock’s future movement. That can be used to determine whether the stock is moving towards the bullish trend or the bearish trend.  

To study the technical indicators correctly, it is important to follow a disciplined approach. In the above section, you learned about the various technical indicators such as RSI, Stochastic Oscillators, etc. that TipRanks uses to calculate the Buy/Sell signals. Next, it is important to understand how these signals work and what they imply about a stock’s future trajectory.  

We can learn about using the technical indicators in our investment strategy with the help of the example of iPhone maker Apple (NASDAQ:AAPL). Below is the screenshot of Apple’s stock chart plotted along with the technical indicators, namely 50-Day EMA (exponential moving average), 20-Day EMA (exponential moving average), RSI (Relative Strength Index), and Pivot Points. 

The technical analysis study shows that AAPL stock is poised for further upward movement. Its 50-Day EMA is 170.52, while its last closing price is $188.06, implying a bullish signal. Further, its shorter-duration EMA (20 days) also signals an uptrend.  

Additionally, Apple’s RSI at 71 does not signal an overbought condition (an RSI above 80 means overbought, and below 20 means oversold). At the same time, while Apple stock is in an uptrend, it could face immediate resistance at $189 (based on Pivot Points).  

By studying these factors and several more that are available on TipRanks’ Technical Analysis page, you can make an informative and timely decision to enter or exit a stock at the given price.  

And finally, by looking at the Summary of All Indicators chart, you will see that the Oscillators display a Buy signal, while the Moving Averages present a Strong Buy signal. A combined Summary signal presents a Buy view based on three Bearish, five Neutral, and 14 Bullish signals (refer to the chart below). 

Top Experts on TipRanks – and How to Leverage Them to Improve Your Investment Strategy

How to Use the Top Analysts page – Follow the Insights of the Top 100 Analysts

Before deciding to follow the stock recommendations of a particular analyst it is advisable to study the analyst’s historical performance. At TipRanks, we consolidate the past performance of analysts and rank them based on the average returns earned per transaction, along with their success rate at giving the right calls on stocks. To study that, visit the Top Analysts page on TipRanks. Navigate to the page from the top menu, by clicking on Experts – Top Analysts.   

On the Top Analysts page, you will find a list of all analysts in the TipRanks universe, ranked based on the proprietary TipRanks Star Ranking System. The list will give you the Analyst Names, the Research Firms they work for, the Sectors they specialize in, their Buy/Hold/Sell rating Distributions, Success Rates, Average Returns earned, and Followers. You can sort the list as per the parameter you want, by simply clicking on the tab.   

An analyst with a high rating has a proven track record of generating attractive returns on stock picks. Depending on your investment strategy, you can choose to follow an analyst based on parameters such as the success rate, average return, or the sector. If you are not seeking exposure to a specific sector, the highest success rates and average returns would be good points to start with.   

On the other hand, if you are interested in investing in a specific sector, select an analyst with the highest ranking in that sector. This way, you are sure of following one of the best sectoral experts, thus increasing your probability of making successful investments.   

Once you have selected the analyst to follow, you can click on the analyst’s name to further study their performance. The analyst page will give you a list of stocks for which the analyst has given recommendations, along with the average return and success rate generated for each stock. Additionally, you can study the analyst’s returns and success rate compared to the benchmark index. You can choose to follow an analyst by clicking on the “+Follow” button on the consolidated list or from each analyst’s page. Once you do so, you will receive regular email alerts each time the analyst gives a new rating on a stock.    

How to Use the Top Performing Research Firms page

TipRanks calculates which research firms perform better than others. We do so by tracking and ranking the Wall Street analysts employed by each firm, based on their Success Rates and Average Returns earned over a period. Plus, we consider the Statistical Significance (number of recommendations made) of the analysts while ranking them. The top performing firms have the greatest number of high-ranking analysts. By analyzing a research firm’s performance, you can confidently decide which analyst can be trusted while considering their stock recommendations.  

Our methodology factors in the success rate, average return, and statistical significance of the ratings of all the analysts from each firm, since 2009. We consider only analysts who have published a rating in the past year. We calculate the average success rate and the average return of all the analysts tracked by TipRanks from each firm, in this case when compared to the S&P 500. Because we incorporate statistical significance into our analysis, the list prioritizes firms with a higher number of ratings. This explains why some research firms may have a higher success rate and average return yet rank lower. 

To navigate to the page, go to Experts – Top Research Firms. On the page, you will find a list of the top 50 research firms ranked based on the factors mentioned above. The page gives you the Rank, name of the Firm, Sector, Rating Distribution of analysts from the firm (Buy/Hold/Sell), Number of Recommendations made by analysts of the firm, Number of Analysts in the firm tracked by TipRanks, a combined Success Rate of analyst ratings, and the combined Average Return of the firm’s analyst ratings. Please note, the list is dynamic and can change daily. 

By default, the page shows the above ranks and data based on the past 1 year’s recommendations and without comparing to any benchmark. You can toggle the tabs of Period to choose the time frame of 1 Year, 1 Month, 3 Months, or 2 Years. Similarly, you can choose to view the firm’s performance as compared to a Benchmark, namely, the S&P 500 index (SPX) or the Sector.  

Now that you have learned how to read the TipRanks Top Research Firms page, try it and see how it positively impacts your investment journey.  

How to Use the Top Financial Bloggers page – follow the Insights of the Top 100 Bloggers

Millions of investors visit financial blogs every month – and use blogger predictions to make crucial investment decisions. But often, these decisions are based on the recommendations of bloggers they know very little about. TipRanks goes one step forward, giving you details about the blogger’s profile, as well as ranking these bloggers based on three broad criteria, thus making it easier for investors to choose whom to trust. In addition to performing in-depth research and making timely stock picks, you can build your investment strategy based on the recommendations of the Top 100 Bloggers listed on TipRanks.   

See an overview of the top bloggers from leading financial blogs and find out which top stocks they are recommending right now. Please note that the list of top bloggers is dynamic, as it is updated daily.  

To see the top 100 bloggers on TipRanks, go to Experts – Top Financial Bloggers. When you open a blogger’s page, you will find their overall profitable transactions, defined as their Success Rate. Plus, you will see the consolidated Average Return per transaction earned on all their views. By default, TipRanks shows you the average return earned in the past month, compared with No Benchmark. You may choose to see the average returns for any Period, namely, 1 Month, 3 Months, 1 Year, or 2 Years, while also comparing the returns with the overall Sector or the S&P 500 (SPX) index.    

Additionally, you will find the information on all the stocks for which the blogger has given their views, along with the most recent Date of the blog, their Position on the stock (bullish/bearish view), total Number of Ratings given on the stock, Success Rate on the rating, and the Avg. Return earned on the stock.     

Just as with other Experts on the TipRanks database, Bloggers are ranked according to their:  

Success rate – the number of accurate recommendations, for one year   

Average return – the average return generated for all transactions, for one year  

Statistical significance – experts with more recommendations are ranked higher  

As an investor, you can choose to follow the opinions of only top bloggers, who have a proven track record of generating attractive returns on most of their stock recommendations.   

How to Use the Top-Performing Corporate Insiders page – follow the Insights of the Top 100 Corporate Insiders

Nobody knows the inner workings of a company better than its insiders. Following an insider’s trading calls can give you considerable insight into the company’s performance. If an insider is highly optimistic about a company’s future, it is quite likely they will go on a stock-buying spree and vice versa when they have some negative information about the company. From the buying/selling patterns of insiders, you can gauge the company’s trajectory.   

This is why TipRanks accumulates insider trading activities and ranks the insiders as per their historical performance. By ranking the insiders, TipRanks helps you decide which insiders are likely the best insiders to follow. These insiders have a proven record of making successful calls on their company stocks and earning generous returns on them, and you could succeed in investing by following their trading activity.   

You can navigate to this page by going to Experts – Top-Performing Corporate Insiders. This page lists the Name of the corporate insiders along with information related to their Company, Role, Distribution of Buy and Sell Transactions, Success Rate, and Average Return earned.  

By default, the page lists the top insiders based on their success rates measured over a 1 Year time frame. You can choose to change the Period between 1 Month, 3 Months, 1 Year, or 2 Years. Similarly, you can choose to compare the returns with a Benchmark such as the S&P 500 (SPX) index or the Sector.   

An insider’s performance is measured based on a 3-tier unique proprietary formula called TipRanks Star Ranking System, as explained below:  

Success Rate – An expert’s success rate is measured by the number of times a transaction wins or loses money.  

Average Return – At TipRanks, we consider the average return of all transactions as the best measure of an expert’s performance. By doing so, we rule out the possibility of single lucky hits and focus on the expert’s overall performance.  

Statistical Significance – A higher number of recommendations ensures the expert’s consistency. For this reason, an expert with more recommendations will have his or her ranking scored higher than an expert with fewer recommendation counts (with all other things being even). 

How to Use the Top Hedge Fund Managers Page

Hedge Fund Managers are well-established investors who have long years of experience and investment acumen. They also have the ability to trade in larger amount of money and their related exposure, that an average investor may be missing. Generally, hedge fund managers are known to take on added risk to earn exponential returns. Although an average investor doesn’t want to make such risky bets, you can learn from their trades and try to emulate them. Thus, it would be interesting to learn about a hedge fund manager’s trading activities to understand which sectors they are currently favoring, and which companies, in particular, are being loaded up on or dismissed by these giant investment firms.   

To navigate to the top-performing hedge fund managers page, go to Experts – Top Hedge Fund Managers from the top menu on the dashboard. On this page, you will find a list of the hedge fund managers in the descending order of their Star Rankings.  

The page lists the Rank, Name of the hedge fund manager, Hedge Fund Name, Assets Under Management (AUM in $ billions), Portfolio Gain (% terms), Sharpe Ratio of the hedge fund manager, Average Return (% terms), Followers on TipRanks, and the option to Follow them.   

By default, the list is sorted based on the hedge fund managers’ rankings. You can choose to sort as per the names of the Hedge Fund or the Managers, or their AUMs, portfolio gains, and so on. Further, you can click on any hedge fund manager’s name to navigate to their profile pages and study them in detail. It could be wise to study and follow those managers who have a proven track record of earning impressive returns with a high success rate.   

Just as with other Experts, TipRanks accumulates the trading patterns of hedge fund managers and ranks them based on three broad parameters:  

Success rate – the number of accurate recommendations, for one year  

Average return – the average return generated for all transactions, for one year  

Statistical significance – experts with more recommendations are ranked higher  

How to Use the Top Individual Investors Page in Your Investment Strategy  

There’s no need to follow the average investor when you can access the transactions of the very best.  

Thousands of investors hold Smart Portfolios on TipRanks. Many of those investors have a high rate of return and have earned a five-star ranking. TipRanks makes it easy to identify the most successful individual investors and see which stocks, cryptocurrencies and ETFs they hold in their portfolios. In addition to performing in-depth research and making timely stock picks, you can build your investment strategy based on the portfolios of the Top Individual Investors listed on TipRanks.  

See an overview of the Top Individual Investors and find out which top stocks they are holding now, as well as their recent transactions. Please note that the list of top individual investors is dynamic, as it is updated daily. 

To see the top individual investors on TipRanks, go to Experts – Top Individual Investors. You will find a list of the top 100 individual investors, listed according to name. You will then see their Portfolio Name, as well as the Portfolio Risk, meaning whether their portfolio has high, medium or low risk. You will also find their overall profitable transactions, defined as Success Rate. Plus, you will see the consolidated Average Return per transaction earned.  

Additionally, you will find the investor’s YTD Return, along with their current number of Holdings. You can also click on Follow to receive alerts about all their new transactions.  

Click on any investor’s name to be brought to a detailed view of their portfolios. There, you can toggle between two views: Performance and Portfolio Details.  

On the Performance view, you will see the individual investor’s Ranking, Success Rate and Average Return.  

Just as with other Experts on the TipRanks database, Individual Investors are ranked according to their: 

Success rate – the number of accurate recommendations, for one year 

Average return – the average return generated for all transactions, for one year 

Statistical significance – experts with more recommendations are ranked higher 

In the Performance view, you will also see a table showing Portfolio Gain over different time frames: 1 Month, 6 Months, 12 Months, and YTD, as well as their Total Return.  

The table beneath shows the investor’s Best Trade. It lists the name of the Asset, the date it was opened (Opened at), and, if relevant, the date it was closed (Closed at). Finally, the chart shows the percentage gain the investor received on that trade.  

On the same page, you will see the investor’s Bio. Below that, you will find a Performance table, showing a comparison between the individual investor’s performance and the benchmark of your choice: TipRanks’ Average, TipRanks’ Best, and/or the S&P 500. You have the option to view this performance comparison as either a bar chart or a line graph.  

Lastly, you will find a chart listing Recent Activity. This chart shows you all the investor’s holdings and transactions on the holdings. For each holding, you will see the Company Name, % of Portfolio that holding represents, percentage Return on that holding, No. Of Transactions made on that holding, type of Last Transaction made on that holding, and the Date of the transaction.   

When you toggle to the Portfolio Details view of each individual investor’s page, you will see two additional tables: Allocation and Portfolio Holdings.   

The Allocation table comprises three pie charts: Top Stocks, By Assets, and By Sector. The Top Stocks chart shows the percentage of each of the most-held stocks within the portfolio. The By Assets chart shows the percentage of each type of asset held in the portfolio: Stocks, ETFs, Funds, Cryptocurrency and Cash. Lastly, the By Sector chart shows the percentage of the portfolio’s holdings in each sector.  

The Portfolio Holdings table shows all the information you need about an individual investor’s holdings. In the table, you will see the Name of the security/asset, the latest Price, Price Change (in % terms) from the previous day, Analyst Consensus on the stock (or ETF), Analyst Price Target on the stock (or ETF) with the related upside/downside potential, Analyst Consensus, TipRanks’ Smart Score for the stock (or ETF), Market Cap, Yearly Gain/Loss (in % terms) from the day of addition, a Follow option, and Alerts (latest happenings on the security.)   

As an investor, you can choose to follow the opinions of top individual investors who have a proven track record of generating attractive returns on their portfolios.  

Website Traffic

How to Use the Website Traffic Chart in Your Investment Strategy

Have you ever wondered how a company’s website traffic can be used to formulate an investment plan? Website traffic is akin to a retail store’s footfall. It measures the number of visitors to a company’s website, including both regular and unique customers, to gauge the popularity of the company’s products and services. By studying the website traffic trends, you can gauge whether a company’s stock is poised for an upward/downward trajectory. The chart is particularly important to study, ahead of a company’s earnings release.  

TipRanks gathers the website traffic data of publicly traded companies from SEMrush and presents it in an easy-to-understand chart. You can analyze the website traffic of a company for the past 18 Months or the last Six Quarters, as you choose. To open the Website Traffic page on TipRanks, open the company which you wish to study, and on the navigation bar on the left, click on the Stock Analysis tool. As you scroll down the page, click on Detailed Usage Analysis under the Product Insights tool to see the company’s Website Traffic page.  

By default, the page will display the monthly website traffic trend for the company. Below the chart, there are four different tabs, which you can toggle to study the company’s trends as per your requirement. For one, you can select which domains are relevant to your study from the dropdown window under the Domains tab. Similarly, you can select the geographical Location for the study from various options, namely Global, U.S., U.K., Global Non-U.S., etc. Next, you can select the types of Devices for which you want to study the website traffic; these include Mobile, Desktop, or All Devices. And lastly, you can choose to study only the Unique Visitors or Total Estimated Visits during the period.  

By hovering over the line graph in the Monthly Chart, you can see details of the website traffic for that month, the prior month, desktop and mobile visit figures, and the price change for the month. Meanwhile, when you hover over the line graph in the Quarterly Chart, you can see the details of the website traffic for that quarter, the prior quarter, desktop and mobile visit figures, and the price change for the quarter.  

Furthermore, for both the monthly and quarterly figures, you can choose to Compare to Traffic from Last Year. This means the data will be shown for the specific month vis-à-vis the comparative prior-year month. Also, in the quarterly chart, the data will be displayed for the specific quarter vis-à-vis the comparative prior-year quarter.  Additionally, you can choose to see a line graph of the Stock Price movement alongside the website traffic trends. This helps you to study how the stock price has behaved when the website traffic is rising or falling in a particular period.  

What’s more, TipRanks gives you a description of the trend analysis of the chart right below it. The data shows you, in bulleted format, the website traffic trends for the latest completed quarter compared to the same quarter last year and compared to the previous quarter, as well as a year-to-date comparison to the same period last year.  

The most interesting part of the chart is the data for the Unreported Period, which is the quarter for which results are yet to be reported. The website traffic data for the unreported period will help you to gauge whether the company’s results will be positive. For example, an e-commerce company’s website traffic trends portray the popularity and usability of the company’s website and demand for its products and thus, can be predictive of the company’s earnings results. An inclining trend projects positive demand momentum, and vice versa for a declining trend. You can use this data to strategically decide whether to invest in a company or not.   

How to Use the Website Growth and User Geography Charts in Your Investment Strategy

On the Website Traffic Page below the Website Traffic Chart, you will find the Website Growth data that can be used to study how the website traffic has behaved over a specific period. This data has similar tabs to the chart and allows you to choose which data you want to study, namely, Domains, Location, Devices, and Visitors. Plus, you can choose whether you want to study the website traffic data compared to the Same Period Last Year or the Previous Period.  

TipRanks will display the results as per the options you select under the various tabs. The main data will be displayed under three main parts: Monthly Growth of the most recently completed month, Quarter-to-Date Growth of the most recently completed quarter, and Year-to-Date Growth. The data will help you to analyze if the traffic trends are improving or declining over months and allow you to take an informed investment decision.  

Right below the Website Growth chart, you will see the User Geography chart. This chart shows you a glimpse of the geographical breakdown of the website traffic globally (U.S., U.K., Germany, India, etc.) for the most recently completed month. You can select the Domains you wish to study, plus you will see the Traffic Share (% of Total Traffic), Traffic (figure in millions), Desktop contribution, and Mobile contribution in percentage terms. Through this chart, you can easily see in which part of the globe the company’s customer growth is improving. 

Finally, at the bottom of the page, you will see that we care about our customers’ input. We have included a box titled, “Are We Missing Any Domains?” through which you can suggest any website, company name or ticker for which we have missed detailing the website traffic trends. Through your suggestions, we can improve our offerings and give the customers exactly what they want. 

How to Use the Website Traffic Screener, “Top Product Insights Stocks,” in Your Investment Strategy

Now that you are aware of the wonders of website traffic trends, it is time to delve into the list of TipRanks’ Top Product Insights Stocks. The list encompasses publicly traded companies with the highest website traffic increase/decrease over the past month. From the list, you can see changes in website traffic from the previous month and uncover the websites with the top traffic gains per industry. By studying this list, you can strategize about whether the companies in your portfolio have the potential to gain or lose demand momentum, and you can reallocate your portfolio accordingly. Also, you can select companies to invest in by scanning those with increasing website traffic.  

To navigate to this page, click on the Website Traffic Screener from the Website Traffic page of any company. Or you can go to Stock Ideas – Top Product Insights Stocks. On this page, you will find two tabs: Top Trending Websites, which shows a list of companies whose website traffic is increasing significantly, and Websites Losing Traffic, which is a list of companies whose website traffic is declining significantly. Please note, this list changes when you toggle between the criteria of Compare to Same Period Last Year and Compare to Previous Period. You can also see the list change if you toggle between companies By Stock (includes all websites) or By Domain. The list is dynamic and keeps changing with time.  

The table also presents quarterly and year-to-date changes in website traffic. You can filter the website category to focus on a particular Online Category (industry) from the dropdown list. You can also adjust the type of Visitors (unique or total estimated visits), type of Devices (all, mobile, or desktop), and the number of Monthly Visitors. Additionally, as with all TipRanks tools, you can adjust the country and see the list of publicly traded companies from that country that have gained or lost the most estimated traffic in the past month. 


Financials

How to Understand the Four Types of Financial Reports TipRanks Provides on Companies: Overview; Income Statement; Balance Sheet; Cash Flow

While researching a stock, it is particularly important to study the company’s financial performance. TipRanks brings you all the relevant financial information about a company and updates the data regularly. We present the data in an easy-to-read tabular format for clear understanding. To open the Financials page, open the company that you want to study. On the left navigation bar, click on the Financials tab.  

TipRanks shows 4 sets of financial data, which are the heart of a company’s financials. By studying these data sets, you can easily gauge a company’s past, present, and future performance. These data sets are: 

Overview – Under this tab, you will find glimpses of all the important metrics from all financial statements including the company’s Income Statement, Balance Sheet, and Cash Flow Statement.  This data is presented only quarterly and updated regularly with every quarterly earnings report. On this tab, you can quickly see the important metrics such as the Total Revenue, EBITDA (earnings before interest tax depreciation and amortization), Total Assets, Total Debt, Stockholders’ Equity, Free Cash Flow, Operating Cash Flow, etc.  

Below the table, you will find four charts related to the company’s Earnings and Revenue History (Revenue, Earnings, Profit Margin), Debt to Assets ratio (Assets, Liabilities, Debt to Assets), Cash Flow (Operating, Investing, Financing), and quarterly Forecast EPS vs. Actual EPS (earnings per share) along with the Beat or Miss. This data can be viewed on both a quarterly and annual basis.  

Income Statement – An Income Statement (IS), also called the Profit and Loss Account, reveals a company’s financial performance during a specific period. The IS presents a breakdown of the Total Revenues and Costs of a company and shows how these line items ultimately convert into either Profit/Earnings or Loss for the company during the stated period.  

TipRanks presents the IS for three different periods namely, the TTM (trailing twelve months), Annually, and Quarterly. The TipRanks IS displays several line items including the Total Revenue, Gross Profit after deducting the cost of revenue, Operating Income, Pretax income, Net Income Available to Common Stockholders, Basic and Diluted EPS, Dividend per share, Basic and Diluted Shares outstanding, Total Expenses, EBIT (earnings before interest and tax), and EBITDA. Studying these data sets can help you understand how the company has managed its revenue and expenses and generated income for its shareholders.  

Additionally, you will see data for 6 historical periods, thus enabling appropriate comparison between the periods. By comparing, you can also see if a company’s financials are improving or deteriorating over time. That helps you make an apt and informed decision about whether or not to invest in the company.  

Below the IS table, you will find an Earnings and Revenue History graph that shows the historical Revenue, Earnings, and Profit Margin.  

Balance Sheet – The Balance Sheet (BS) presents the as-on-date condition of a company’s assets and liabilities. TipRanks gives you a detailed break up of all the important line items of a balance sheet. These include Current Assets and Current Liabilities, Total Non-Current Assets and Total Non-Current Liabilities, Stockholder’s Equity, Current and Long-Term Debt, Total Capitalization, Cash & Cash Equivalents, etc.   

TipRanks displays both Quarterly and Annual Balance Sheets. It is important to note that a balance sheet will show you the financial position of a company on the date of reporting, as against during a period, as is the case with Income Statements. The amounts of assets and liabilities can change immediately on the following day. By studying the balance sheet, you can understand how well a company is capitalized and its liquidity position based on its current asset and liability position. Also, you will know if the company has enough cash to meet its daily outflows. The current assets and liabilities show you the short-term picture of the company while the long-term (non-current) assets and liabilities show you the long-term health of the company. Thus, studying the balance sheet of a company before investing in the stock can be beneficial in understanding its overall financial health. Finally, right below the table, you will find a graphical representation of the historical Assets, Liabilities, and Debt to Assets ratio of the company.  

Cash Flow – The Cash Flow Statement (CFS) presents where a company’s funds are coming from, where the funds are flowing to, and how the company is managing its operations. It is a statement to project what happened to a company’s cash position during a specific period. The statement is calculated by taking the difference between the relevant current and prior account balances from the balance sheet line items.  

Importantly, the cash flow statement is broken down into three parts as follows: 

  • Operating Cash Flow – cash flow from Operating Activities includes the regular inflow and outflow of cash from the general operations (purchase, sale, interest, salaries, etc.) of a business. It implies how much cash is generated from the company’s goods and services (operations).  
  • Investing Cash Flow – cash flow from Investing Activities includes the purchase and sale of both physical (machinery, real estate, etc.) and intangible (patents, copyrights, etc.) assets of a company by using the available cash and net debt.  
  • Financing Cash Flow – cash flow from Financing Activities includes the inflow and outflow of cash from both the debt (repayment of loans, etc.) and equity (dividends, stock repurchase, etc.) financing activities.   

By calculating these different cash flows, you arrive at the End Cash Position, which is the total of the above three mini-statements. By studying the individual mini-statements, you can understand where the company is losing money and in which activities it is making money.  

Finally, you will see the Free Cash Flow (FCF), which is the amount of cash left after paying all the business obligations, including operating expenses and capital expenditures, during a period. Investors and shareholders often study a company’s free cash flow to see if it has enough cash to pay dividends, repay debt, and engage in mergers & acquisitions (M&A). At the bottom of the page, you will see a graphical representation of the historical Cash Flow including the Operating, Investing, and Financing Cash Flows.  

How to Understand the “Earnings and Revenue History” Graph

The Earnings and Revenue History graph shows you the historical data of Revenue, Earnings, and Profit Margin for the last 10 quarters or the last six financial years. The graph is simple and easy to understand because it includes only 3 data points, which are projected through bar and line graphs.  

Revenue and Earnings are displayed on a bar graph, while the Profit Margin is displayed on a line graph. Studying the historical performance of these line items helps you to understand if the company’s revenues and earnings are growing or declining, and how the profit margins have changed over time.  

An increasing trend in revenue and earnings means the company is growing its business steadily. Also, an inclining trend in the profit margin line shows that the company is growing its profitability by managing its expenses efficiently. The opposite holds when the trend is in the downward direction, implying that the company may not be managing its business efficiently.  

How to Understand the “Debt to Assets” Graph

The Debt to Assets graph displays three data points: the company’s Total Assets, Total Liabilities, and Debt to Assets ratio. You can view the historical data of these three items for the last 10 quarters or the last six financial years. 

The Assets and Liabilities are displayed on a bar graph, while the ratio is displayed through a line graph. It is important to analyze the financial health of a company before making any investments. Studying this graph will help you to figure out if the company’s balance sheet size is growing or shrinking. This is especially important while studying sectors such as banks, since their deposit and loan balances play an important role in business functionality.   

Similarly, the trend of the Debt to Assets ratio will indicate whether the company’s debt proportion is growing against its asset base, which implies its liquidity position. If the company is short of liquidity, it will not be able to pay off its regular interest and principal repayments, thus running into default. Further, if the debt is indeed growing, it reflects poorly on the financials of the company unless the company has a specific agenda with the debt, for instance, to fund an acquisition or to fund an expansion. It’s a good idea to carefully study the trend demonstrated by these line items to gauge the company’s health and then make an informed investment decision.  

How to Understand the “Cash Flow” Graph

TipRanks plots the cash flows from Operating, Investing, and Financing activities on a line graph. You can view the historical data of these three items for the last 10 quarters or the last six financial years. By studying the trend in these items, you can understand how the company’s cash flows are impacted by each broad activity.  

In the case of Operating Cash Flows, an inclining trend indicates that the company is able to generate more cash from its regular business operations, which is a healthy sign. When the economy is in good shape, the company should be able to constantly grow its cash flows from operating activities, indicating an inclining trend in the graph. On the other hand, during tough times, the company’s cash flows from operating activities may show a declining trend. 

In the case of Investing Cash Flows, an increase may mean that the company is spending more on capital expenditure.  

In the case of Financing Cash Flows, an increasing trend may mean the company is raising more capital, either through debt or equity. In contrast, a declining trend may mean the company is utilizing more cash on activities such as repurchasing shares, dividend payments, loan repayments, etc.  

How to Understand the “Forecast EPS vs. Actual EPS” Graph

The Forecast EPS vs. Actual EPS graph displays a bubble chart comparing the forecasted earnings per share (EPS) vis-à-vis the actual EPS reported by the company. Plus, the chart shows whether the company has outpaced or missed the Forecasted EPS. The chart is displayed for the last six reported quarters.  

You can see three different colored bubbles on the chart: a gray bubble shows EPS Estimates, a blue bubble shows an estimate Beat, and a pink bubble shows an estimate Miss. By studying the chart, you can see whether the company has been constantly missing or beating analysts’ earnings expectations. A company that constantly beats expectations may be poised for favorable future growth, while a company that constantly misses expectations may be poised for a downward stock trajectory. Thus, by studying the chart you can make your investment decision between various comparable stocks.  

Dividend Pages

How to Use the Dividend Calculator

Dividends are payments that publicly traded companies make to their shareholders. Companies that offer dividends share their profits with their investors. A company’s board of directors decides on the frequency and amount of dividend per share to be paid to shareholders. Dividends are a great way to earn recurring income from a stock investment. For those investors who seek to earn regular income and are not chasing enormous stock price appreciation, dividend stocks are some of the best investment options. What’s more, dividends protect you against market volatility.  

TipRanks offers a fully loaded dividend calculator mechanism. To navigate to this page, go to Dividends – Dividend Calculator. On this page, you will find a dividend calculator that allows you to calculate the various parameters such as dividend yield, projected annual payout, and total dividend payment, according to your investment criteria. 

To calculate the expected income of any dividend stock, (meaning, any stock that offers its investors dividend payments), follow the steps listed below: 

  1. Insert the name of the stock – this step automatically fills out a few relevant fields such as the current Share Price, Expected Dividend Yield, dividend Distribution Frequency, and the payout method, which is either a dividend reinvestment plan (DRIP) or cash/ check payout. 
  1. Insert the number of shares you plan to purchase 
  1. Select the investment holding period 
  1. Optional: you can change the Expected Annual Dividend Increase (in % terms) and the Expected Annual Share Price Increase (in % terms), as well as choose to see the result with or without DRIP (when the company pays dividends, they are automatically reinvested into the stock.) 

Finally, click on the Calculate My Returns button, and the dividend calculator will populate the figures based on your inputs at the end of the selected investment holding period. The end-of-period projections show you the End Balance, Total Return, Average Annual Return, Annual Dividend Income, Total Dividend Payment, and Yield on Cost.   

You can also use the calculator to measure expected income based on your own terms. To do this: 

  1. Choose a share price 
  1. Adjust the number of shares 
  1. Insert expected dividend yield 
  1. Select dividend distribution frequency and click on Calculate My Returns 


You can adjust your calculations, for example by changing the Investment Amount, the Number of Shares, Annual Contribution, Dividend Tax Rate, an Expected Annual Dividend Increase, Expected Annual Share Price Increase, and Payment Type (dividend reinvestment plan or without DRIP) to see how these changes would affect returns. 

As you scroll down the page, you can see a table giving a breakdown of your dividend income schedule in a tabular format. Here you will see the Year, Shares Owned, Annual Dividend Per Share, Annual Dividend (in $ terms), Compound Frequency, Annual Contribution, Year-End Shares Owned, Year-End Stock Price, and New Balance.  

You can even calculate dividends for Canadian, U.K., Australian, German, Spain, and Singapore dividend stocks. Additionally, you will see a daily list of all companies on their respective Ex-Dividend Dates along with the Amount, Yield, and Payment Date. 

How to Use the Dividend Stock Comparison Tool

Several companies reward shareholders with regular and handsome dividend payments. As an investor, you can be spoiled for choice and have difficulty deciding which one is the best dividend-paying stock for you. Well, TipRanks makes this easier for you with its Dividend Stock Comparison Tool. You can compare several dividend stocks on this page and decide which one suits you the best. By comparing a company’s dividend information alongside the various TipRanks tools such as analyst price target and consensus view on the stock, you can make an informed decision about whether the stock is worth investing in.  

For instance, consider a dividend stock that may be poised for negative price movement and has a Sell consensus rating by Wall Street analysts. Those factors could imply that in the event of underperformance, the company’s board might choose to pause the dividend payments in the future. In such cases, it would be advisable to steer clear of the stock and select a more appropriate one.  

To navigate to the Dividend Stock Comparison Tool, go to Dividends – Dividend Stock Comparison. On this page, you will find the top ten most trending and highest-paying dividend stocks on TipRanks’ database.    

By default, the list will show you the Stock Ticker Name, the latest closing Price, Price Change (1 day), Analyst Price Target on the stock, Analyst Consensus on the stock, Volume of shares traded, Market Cap of the company, Dividend Yield, the TipRanks Smart Score for the stock, links to the latest Articles on TipRanks, and the option to Follow the stock. You can customize the tabs to compare the stocks based on any of TipRanks’ unique tools. Additionally, you can choose to compare the dividend-paying stocks based on TipRanks Essentials tools, Dividend information, Earnings information, Technical parameters, and Performance (daily/monthly/yearly/year-to-date).    

Further down on the page, you can see the price Performance Comparison of the stocks in the list over a period and study how the stocks have been performing historically. Additionally, you can see a section on the Dividend Stocks Latest News. You can click on any news headline you like and read it further.  

As you scroll down further, you will see the most Recent Analyst Ratings of Dividend Stocks. By going through this section, you can analyze if any analysts have recently changed their stance on the stock’s trajectory and why. And finally, you will see the details of the Most Recent Earnings of Dividend Stocks. 

How to Use the Best Dividend Stocks Tool

To make your investing research easier, we have curated a list of the Best Dividend Stocks from various geographies, wherein we feature the top dividend-paying stocks on the market. The list comprises dividend-paying stocks that have a TipRanks Smart Score of Perfect 10. This makes these stocks a safer bet, given their high chances of outperforming market expectations.  

To navigate to this page, go to Dividends – Best Dividend Stocks. You can choose to see the list sorted as per the Market Cap (Mega/Large/Medium/Small/Micro) or based on the Sector. Please note, the list is dynamic and could change daily based on the changes in the stock’s Smart Score.   

On the list, you will see the Name of the company and stock ticker, the latest stock Price & Change for one day, the Analyst Price Target for the stock, the per share Dividend Amount on the stock, the related Dividend Yield, the Analyst Consensus on the stock, Market Cap, Yearly Gain (or loss) in price, and the Smart Score of Perfect 10. 

You can sort the list in ascending or descending order on the basis of any one of the criteria. As with all TipRanks tools, you can select the geography for which you wish to see the list of the Best Dividend Stocks. Plus, you can download the data in Excel. 

By studying this list, you can easily analyze which dividend-paying stocks are high on the analysts’ radar, as indicated by their consensus and price targets. Also, you can scan the dividend amounts and yields to choose the best from the available options. As mentioned earlier, since all these dividend stocks have a Smart Score of Perfect 10, these are highly likely to outperform market expectations and could be considered good income-generating stocks to add to your portfolio.  

How to Use the Dividend Returns Comparison Tool

Similarly, to the Dividend Comparison Tool, TipRanks also hosts a Dividend Returns Comparison Tool, to aid you in comparing the potential dividend return of different stocks. The tool is simple to use, and you could choose a list of stocks for which you want to compare the dividend returns. By studying the different dividends and total returns earned after a specific period, you can decide upon the best stock to be added to your portfolio.  

To navigate to this page, go to Dividends – Dividend Returns Comparison. To start comparing the returns of your choice of dividend-paying stocks, first select the stocks that you want to study. Enter the Company Name or Ticker symbol of the stocks in the space provided. Please note, the list will accept only those stocks that pay dividends at the time of your research.   

Next, simply enter an Investment Amount, the expected Holding Period (in years), and whether or not you wish to re-invest your dividends via DRIP (Dividend Reinvestment Plan) in the boxes provided. After entering the relevant information, click on Calculate, and voila, TipRanks will calculate the Total Return and all the valid dividend-related data for the stocks chosen by you.   

The list comprises several fields. These include the ticker Symbol of chosen stocks, the respective Company Name, the latest Price of the stock, 1Y Stock Gain (or loss) in % terms, the calculated Dividend Yield, number of Start Shares, the number of End Shares, related Annual Income, End Balance of the investment amount in dollars, Total Dividends earned at period end, and Total Return earned at period end.  

How to Use the Best High Yield Dividend Stocks Tool

Are you chasing regular income-earning stocks? Well, just receiving dividends may not be sufficient. It is equally as important to choose stocks that have a high dividend yield. To improve your stock-picking prowess in regard to dividend stocks, we curated a list of the best high dividend-yielding stocks on TipRanks.  

A dividend yield is considered an effective barometer when comparing dividend-paying stocks. It is difficult to decide if a stock is paying better dividends than other stocks, based only on the absolute dollar amount of dividends. The dividend yield is a percentage that shows the annual dividend payout relative to the share price. It offers a way to understand dividends as a proportion of your investment and is a good tool for comparing dividend stocks. 

Dividend Yield = Dividend Amount x Dividends Per Year 

Initial Share Price 

To navigate to this page, go to Dividends – Best High Yield Dividend Stocks. You can choose to see the list sorted as per the Market Cap (Mega/Large/Medium/Small/Micro) or based on the Sector. On this page, you will see a list of the highest dividend-yielding stocks (yielding more than 5%) to date. The list is dynamic and changes with adjustments in the stock’s dividend yields.  

The table displays the Name of the company and ticker symbol, the latest stock Price & Change for one day, the Analyst Price Target on stocks, the per share Dividend Amount, the current Dividend Yield on stocks, the Analyst Consensus on stocks, the current Market Cap of stocks, the Yearly Gain (or loss), and the TipRanks Smart Score (mostly 8, 9 or Perfect 10 stocks). 

If you are an income investor, this list can help you to easily scan which stocks are paying the highest dividend yield currently and decide to add them to your portfolio. Also, you can sort the list in ascending or descending order on the basis of any one of the criteria. As with all TipRanks tools, you can select the geography for which you wish to see the list of the Best High Yield Dividend Stocks. Plus, you can download the data in Excel. 

How to Find the Latest Dividend News

If you have decided to invest in dividend-paying stocks and receive a regular income, it is advisable to follow the latest news related to these stocks. TipRanks has a special page dedicated to news for dividend-paying stocks. To navigate to the page, go to News – Dividend Stock News. 

Visiting the Dividend Stock News page daily will help you stay updated on the latest happenings on dividend stocks. You can continue your research journey by staying abreast of the latest news and deciding on your investment choices accordingly. You can click on any news headline you like and read it further. Any positive news will boost confidence in the stock’s trajectory and dividend-paying ability, while the opposite holds true for any negative news. You can also navigate to this page by scrolling down on the Dividend Stocks Comparison page.  

How to Use the Smart Portfolio Dividend Analysis in Your Investment Strategy

Have you created your portfolio yet on the TipRanks Smart Portfolio tool? While the Smart Portfolio helps you stay updated with the performance of your portfolio, it also offers several comparison techniques to help you understand why and how your portfolio performance can be improved. One of these factors is the performance of dividend-paying stocks, along with their contribution to your portfolio. Not only do dividend stocks pay regular income, but they also help you to protect your investment during market volatility. Irrespective of your risk-return appetite, you should consider having at least a part of your portfolio in dividend stocks.  

So, here’s one way in which TipRanks helps you to analyze your portfolio’s investment strategy. In your Smart Portfolio, go to the Analysis section. On the page, you will find the Stock Distribution section under which you have the option to study the portfolio distribution By Dividend. When you click on the tab, you will see the percentage distribution from dividend-paying stocks (Positive >0%) against No Dividend stocks. Alongside that, you will find the top five company names of Major Holdings for the respective dividend-paying and non-dividend-paying stocks. Additionally, under the Positive dividend-paying stocks list, you will see the Dividend Yield of each stock.  

When you scroll down further, you will see the Portfolio Dividends tab. Under this tab, you can see the My Top Dividend Stocks from your portfolio, along with the Yield. Plus, you will see the Upcoming Dividends and Ex-Dividend Dates for your portfolio of companies. And you will see the Estimated Annual Dividend Payment based on your current holdings.  

Analyzing this data will help you strategically decide if you want to increase or decrease the contribution of dividend stocks to your portfolio. You can also decide to replace the lower dividend yield stocks with better yield stocks and reshuffle your portfolio accordingly. TipRanks provides you with all this information on a single page to help you align your portfolio with your investment goals.  

Moreover, under the Crowd Insights section on the Smart Portfolio, you will find the Key Statistics, which also includes a comparison of My Portfolio Yield with that of the Average Portfolio Yield of all investor portfolios on TipRanks. By comparing the two yields and the list of stocks that contribute the highest yields, you will figure out whether you have the most attractive dividend stocks in your portfolio. You will also understand which dividend stocks other investors are buying and thus consider similar investments. And finally, under the My Calendar section of the Smart Portfolio, you can see the Calendar highlighted with the Ex-Dividend Dates and a list of stocks for which the Ex-Dividend date is coming soon.  

 How to Use the Dividend Calculator

Dividends are payments that publicly traded companies make to their shareholders. Companies that offer dividends share their profits with their investors. A company’s board of directors decides on the frequency and amount of dividend per share to be paid to shareholders. Dividends are a great way to earn recurring income from a stock investment. For those investors who seek to earn regular income and are not chasing enormous stock price appreciation, dividend stocks are some of the best investment options. What’s more, dividends protect you against market volatility.  

TipRanks offers a fully loaded dividend calculator mechanism. To navigate to this page, go to Dividends – Dividend Calculator. On this page, you will find a dividend calculator that allows you to calculate the various parameters such as dividend yield, projected annual payout, and total dividend payment, according to your investment criteria. 

To calculate the expected income of any dividend stock, (meaning, any stock that offers its investors dividend payments), follow the steps listed below: 

  1. Insert the name of the stock – this step automatically fills out a few relevant fields such as the current Share Price, Expected Dividend Yield, dividend Distribution Frequency, and the payout method, which is either a dividend reinvestment plan (DRIP) or cash/ check payout. 
  1. Insert the number of shares you plan to purchase 
  1. Select the investment holding period 
  1. Optional: you can change the Expected Annual Dividend Increase (in % terms) and the Expected Annual Share Price Increase (in % terms), as well as choose to see the result with or without DRIP (when the company pays dividends, they are automatically reinvested into the stock.) 

Finally, click on the Calculate My Returns button, and the dividend calculator will populate the figures based on your inputs at the end of the selected investment holding period. The end-of-period projections show you the End Balance, Total Return, Average Annual Return, Annual Dividend Income, Total Dividend Payment, and Yield on Cost.   

You can also use the calculator to measure expected income based on your own terms. To do this: 

  1. Choose a share price 
  1. Adjust the number of shares 
  1. Insert expected dividend yield 
  1. Select dividend distribution frequency and click on Calculate My Returns 


You can adjust your calculations, for example by changing the Investment Amount, the Number of Shares, Annual Contribution, Dividend Tax Rate, an Expected Annual Dividend Increase, Expected Annual Share Price Increase, and Payment Type (dividend reinvestment plan or without DRIP) to see how these changes would affect returns. 

As you scroll down the page, you can see a table giving a breakdown of your dividend income schedule in a tabular format. Here you will see the Year, Shares Owned, Annual Dividend Per Share, Annual Dividend (in $ terms), Compound Frequency, Annual Contribution, Year-End Shares Owned, Year-End Stock Price, and New Balance.  

You can even calculate dividends for Canadian, U.K., Australian, German, Spain, and Singapore dividend stocks. Additionally, you will see a daily list of all companies on their respective Ex-Dividend Dates along with the Amount, Yield, and Payment Date. 

Hedge Fund Pages

How to use the Hedge Fund Activity Tool to Track Institutional Buying and Selling

Hedge Funds are large institutional investors that usually hold sizable stakes in publicly traded companies. Hedge funds undertake complex investing strategies and thus are able to generate higher returns by taking on higher risks. By virtue of their large investments and outsized stakes in some companies, hedge fund owners often have a seat on the company’s boards and/or are one of the driving forces for the important decisions made at the management level.  

Given that, wouldn’t it be interesting to know which company stocks hedge funds are buying or selling, as a clue to understanding how the company is performing? Well, we at TipRanks believe that Hedge Fund Managers often know best about company happenings and can be some of the best investment opinions to follow.  

Thus, TipRanks accumulates the hedge fund trading activity of stocks in a simple, understandable format and gives you the opportunity to make informed decisions based on their trading activities.  

To access the Hedge Funds Trading Activity tool on TipRanks, first open a company’s page for which you want to see the hedge fund activity. On the navigation bar on the left, you will see the Hedge Funds tab. Click on the tab to view the page.  

On the page, you will find the Hedge Fund Confidence Signal that displays the sentiment on the stock, based on the buy and sell activity of several hedge funds in the recent quarter. The sentiment will be one of the following: Very Positive/Positive/Neutral/Negative/Very Negative. If most hedge funds are increasing their holdings of the stock, the signal will be on the positive side. On the other hand, if hedge funds are dumping the stock, the signal will be on the negative side. It will be neutral in cases of mixed trading activity.  

Additionally, you will see a graphical representation of the hedge fund activity on a quarterly basis, to see how hedge funds have behaved in the past with respect to the stock. By studying the graph, you can also delve deeper into why hedge funds may have changed their position in the company over the quarters, from positive to negative, or vice versa. Was it due to some important structural changes, earnings misses, etc.? This gives you the much-needed information to understand a stock’s future trajectory.  

Finally, you will see a list of all the hedge fund buying/selling activity on the stock starting from the most recent. The list includes the name of the Hedge Fund Manager, Star Ranking, name of the Firm, Activity (New/Added/Not Changed/Reduced), Holding Change (% terms), Value Reported ($ terms), % of Portfolio, and the option to Follow the hedge fund. You can click on any of the hedge fund managers’ names to further study their profiles and trading activities in detail. You can also sort the list as per Activity or Star Ranking.  

How to Use the Top Hedge Fund Managers Tool

Hedge Fund Managers are well-established investors who have long years of experience and investment acumen. They are also able to trade in larger amount of money and their related exposure, that an average investor may be missing. Hedge fund managers are known to take on added risk to earn exponential returns. Although an average investor is unlikely to take such risky bets, you can learn from the hedge fund managers’ trades and try to emulate them. Thus, it could be interesting to learn about a hedge fund manager’s trading activities to understand which sectors they are currently favoring, and which companies, in particular, are being loaded up on or dismissed by these giant investment firms.  

To navigate to the top-performing hedge fund managers page, go to Experts – Top Hedge Fund Managers from the top menu on the dashboard. On this page, you will find a list of the hedge fund managers in the descending order of their Star Rankings. 

The page lists the Rank, Name of the hedge fund manager, Hedge Fund Name, Assets Under Management (AUM in $ billions), Portfolio Gain (% terms), Sharpe Ratio of the hedge fund manager, Average Return (% terms), Followers on TipRanks, and the option to Follow them.  

By default, the list is sorted based on the hedge fund managers’ rankings. You can choose to sort as per the names of the Hedge Fund or the Managers, or their AUMs, portfolio gains, and so on. Further, you can click on any hedge fund manager’s name to navigate to their profile pages and study them in detail. It could be wise to study and follow those managers who have a proven track record of earning impressive returns with a high success rate.  

Just as with other Experts, TipRanks accumulates the trading patterns of hedge fund managers and ranks them based on three broad parameters: 

Success rate – the number of accurate recommendations, for one year 

Average return – the average return generated for all transactions, for one year 

Statistical significance – experts with more recommendations are ranked higher

How to Use the Hedge Fund Profile Pages in Your Investment Strategy

Hedge fund managers are hailed as the Gurus of the financial investment world. Their years of experience, access to a larger pool of funds, wide array of investment strategies, and a thorough knowledge of almost all sectors make them some of the best people to follow. Of course, not all hedge fund managers succeed at their stock-picking activities, but several are well-known on Wall Street for their investment acumen and the enormous returns they generate on trades. To make it easier for you to decide whom to trust, TipRanks compiles a list of the top-performing hedge fund managers and gives you details about their historical success rates and returns generated.  

On a hedge fund manager’s profile page, you can find the firm that they work for and their Portfolio Gain since June 2013. You can also see their Sharpe Ratio, which is defined as your portfolio’s returns divided by your portfolio’s risk. A ratio above “1” means the portfolio manager has earned higher returns compared to the risk of the portfolio.  

Moreover, you will see the Net Worth of the Hedge Fund, which is the assets under management (AUM) of the firm as reported to the Securities and Exchange Commission (SEC) that the portfolio manager oversees. Plus, you can see the Average Return Earned in the Last 3 Years (Annualized), the Last 12 months, and Since Last Filing date. Further, you will see the Portfolio Breakdown by Sector, which displays the sectors in which the AUM is distributed.  

Moreover, you can see the details of each company to which the hedge fund manager has exposure, as per the latest SEC filing. Along with a graphical representation, you will see the Company Name, the latest Action taken (New/Added/Not Changed/Reduced), the company’s Sector, the stock’s Average Price in Last Quarter, Gain/Loss Since Last Filing (% terms), Holding Change (% terms), Value Reported ($ amount), and % of Portfolio.  

Further down on the page, you will see the Measured Performance, which displays the hedge fund’s performance vis-à-vis the S&P 500 (SPX) index, and Average Hedge Fund Portfolio. This is followed by a general FAQ section on the particular hedge fund, mostly based on queries related to the hedge fund profile page.  

To navigate to a hedge fund managers profile page, go to Experts – Top Hedge Fund Managers, and there you will find a list of all hedge fund managers that TipRanks tracks. Clicking on a particular hedge fund manager’s name opens their profile page. Alternatively, if you know the name of the hedge fund manager that you wish to study, you can type his/her name in the Search Bar on the top left corner of the page and select the name from the dropdown window. Similarly, you can navigate to a hedge fund manager’s profile page by going to a company’s Hedge Funds Tool and clicking on the Hedge Fund Manager’s Name from the list of hedge fund trading activities.   

How We Update Hedge Fund Pages

TipRanks accumulates the data of thousands of hedge funds and breaks it down into simple easy-to-read formats to make it easy for our customers to understand. TipRanks updates the Hedge Fund Pages every quarter, by scanning regulatory filings on a timely basis through its top-notch artificial intelligence (AI) technology.    

Hedge funds that invest over $100 million in equity are required to submit a form 13F to the SEC within 45 days after the end of each quarter. TipRanks automatically retrieves all these filings from the public EDGAR database and uses proprietary algorithms to backtrack performance.  

By regularly updating the hedge fund database on the platform, TipRanks ensures that you have access to the latest information on the buying and selling activities of these firms and can customize your portfolios intelligently.  

Bloggers

How to Access and Interpret Bloggers’ Opinions on TipRanks

There are plenty of seasoned professionals with a proven track record who can help inform your investment decisions. And while financial bloggers may not attract the same attention as Wall Street analysts, they are a powerful source of information, with their provision of independent stock research. TipRanks accumulates blogger opinions and presents them in an easily understandable, data-based format, to help you make informed decisions. 

To access the Blogger Opinion page on TipRanks, first open a stock’s page for which you want to see the blogger’s sentiment. On the navigation bar on the left, you will see the Blogger Opinion tab. Click on the tab to open the page.  

Right on top of the page, you will see Blogger Sentiment and Blogger Article Distribution. The Blogger Sentiment is presented as Bullish, Neutral, or Bearish. The sentiment is calculated based on all the blogger opinions given for a particular stock as compared to the overall sector, often referred to as a comparison with the sector’s sentiment. So, if a stock has an 80% Bullish Sentiment and the sector has an average sentiment of 75%, you can say that blogger sentiment for the stock is More Bullish than other stocks in the sector and hence may be a stock to consider. 

Meanwhile, the Blogger Article Distribution chart shows the percentage-wise distribution of blogger articles on each stock amongst the main online financial blogging platforms. 

Below this, you will find the latest views from bloggers under the Top Blogger Bearish Predictions and Top Blogger Bullish Predictions lists. It is important to note that the views of top bloggers only are included in this list. Briefly, from the headlines, you can often see why a particular blogger is bearish or bullish on the stock. To learn more about the full view of the blogger, click on the news link. Furthermore, you will find the consolidated table comprising the latest opinions of all bloggers on the stock, which you can utilize to make an informed investment decision.  

How to Use the Top 100 Bloggers Page in Your Investment Strategy

Millions of investors visit financial blogs every month – and use blogger predictions to make crucial investment decisions. But often these decisions are based on the recommendations of bloggers about whom they know very little. TipRanks goes one step forward, giving you details about the blogger’s profile, as well as ranking these bloggers based on three broad criteria, thus making it easier for investors to choose whom to trust. In addition to performing in-depth research and making timely stock picks, you can build your investment strategy based on the recommendations of the Top 100 Bloggers listed on TipRanks.  

See an overview of the top bloggers from leading financial blogs and find out which top stocks they are recommending right now. Please note that the list of top bloggers is dynamic, as it is updated daily. 

To see the top 100 bloggers on TipRanks, go to Experts – Top Financial Bloggers. When you open a blogger’s page, you will find their overall profitable transactions, defined as Success Rate. Plus, you will see the consolidated Average Return per transaction earned on all their views. By default, TipRanks shows you the average return earned in the past month, compared with No Benchmark. You may choose to see the average returns for any Period, namely 1 Month, 3 Months, 1 Year, or 2 Years, while also comparing the returns with the overall Sector or the S&P 500 (SPX) index.   

Additionally, you will find the information on all the stocks for which the blogger has given their views, along with the most recent Date of the blog, their Position on the stock (bullish/bearish view), total No. of Ratings given on the stock, Success Rate on the rating, and the Avg. Return earned on the stock.    

Just as with other Experts on the TipRanks database, Bloggers are ranked according to their: 

Success rate – the number of accurate recommendations, for one year 

Average return – the average return generated for all transactions, for one year 

Statistical significance – experts with more recommendations are ranked higher 

As an investor, you can choose to follow the opinions of only top bloggers who have a proven track record of generating attractive returns on most of their stock recommendations.  

Informative Transactions vs. Uninformative Transactions 

While TipRanks consolidates thousands of insider trading activities daily, we go one step further and define these trades as informative versus uninformative. The reason? Informative trades hold more significance from an investor’s trading perspective compared to uninformative trades. While Uninformative Buys and Sells can occur due to myriad reasons, the Informative Buy essentially means the insider sees a bright future for the company, or at least a bright future for his or her own trading account.    

Uninformative transactions indicate that an Insider is buying/selling shares for reasons that do not necessarily indicate confidence in the company. Therefore, they do not hold much significance. For example, an Uninformative Buy in insider trading can be a trade made by an insider who is given shares as a form of compensation. Likewise, Uninformative Sells are often made by Insiders who are exercising options that are about to expire, or cashing in shares that are given to them as a form of payment. 

On the other hand, Informative Buy/Sell transactions are deliberately made by Insiders, thus indicating a vote of confidence in the company. The Informative Buy transaction particularly stands out as a Buy signal for anyone watching. An Informative Buy trade is an instance wherein an insider decides to make a purchase of company shares with his or her own capital. These are significant, as they show an assertion of confidence in the company and its future by the insider and indicate that the stock may gain in price thereafter.   


Insider Trading Pages

How to Use the Insiders’ Hot Stocks Screener

Do you know who has the best shot at making an accurate judgment of a company’s future trajectory? That’s right! It’s the company’s corporate insiders themselves. These insiders are in the know about the company’s latest developments and can most accurately foretell if a company is heading for success or failure. As an investor, following the trading activities of these insiders can prove to be highly beneficial when searching for new investment ideas. 

Corporate insiders are C-level Executives, Directors, or 10% Shareholders of a company. Because of their insider knowledge, insiders are required to report their buy/sell trades of the company’s shares to the Securities and Exchange Commission (SEC) within two working days. While these documents (Form 4) are publicly available, it can be quite tedious for an average investor to keep track of them. TipRanks makes this easier for you by scanning all the publicly available documents and putting them under one roof – the Top Insiders Stocks tool. TipRanks’ proprietary AI scans the SEC reports about insider trades, translates it into easily digestible data, and then presents it to our users in several formats. 

This is one of the most popular tools on the TipRanks portal. You can navigate to this page by going to Stock Ideas – Top Insiders Stocks. On this page, you will find four different trading strategies that TipRanks has identified based on insider trading activity. All strategies currently beat the S&P 500. Performance has been measured since January 2009 and each transaction is measured after one month. You can compare strategies to their sector or to the S&P 500. 

Transaction Strategy – This strategy includes the buy and sell transactions of All Insiders. 

C-Level Strategy – This strategy includes the buy and sell transactions of Officers only. 

Major Event Strategy – This strategy includes the buy and sell transactions undertaken by a major institutional investor, such as the owner.   

Top Ranked Strategy – This strategy includes the buy and sell transactions of Top-ranking Insiders only.   

As you scroll down, you can see the latest insider buy and sell transactions, labeled Hot Stocks by Insiders. This list shows you the trending stocks on which insiders are making trades, along with an indication of the Insider Strategy Signal as Very Positive or Positive. You can use this list to devise an apt investment strategy. Most of these strategies have generated handsome double-digit returns to date and can prove beneficial to your portfolio. 

It is important to note that this list includes only the Informative Buy trades. You can also see Signal Reasoning, which explains the insider trading trend behind the signal. Further, under the Activities tab, you can see a list of the number of shares with the dollar amount of the informative buy trade by the insider and the time frame. You can even customize the list through the dropdown Select Columns as well as download the data on an Excel spreadsheet.  

How to Use the Top Corporate Insiders Tool

Nobody knows the inner workings of a company better than its insiders. Following an insider’s trading calls can give you considerable insight into the company’s performance. If an insider is highly optimistic about a company’s future, it is quite likely they will go on a stock-buying spree and vice versa when they have some negative information about the company. From the buying/selling patterns of insiders, you can gauge the company’s trajectory.  

This is why TipRanks accumulates insider trading activities and ranks the insiders as per their historical performance. By ranking the insiders, TipRanks helps you decide which insiders are likely the best insiders to follow. These insiders have a proven record of making successful calls on their company stocks and earning generous returns on them, and you could succeed in investing by following their trading activity.  

You can navigate to this page by going to Experts – Top-Performing Corporate Insiders. This page lists the Name of the corporate insiders along with information related to their Company, Role, Distribution of Buy and Sell Transactions, Success Rate, and Average Return earned. 

By default, the page lists the top insiders based on their success rates measured over a 1 Year time frame. You can choose to change the Period between 1 Month, 3 Months, 1 Year, or 2 Years. Similarly, you can choose to compare the returns against a Benchmark, such as the S&P 500 (SPX) index or the performance of stocks in the overall Sector.  

An insider’s performance is measured based on a 3-tier unique proprietary formula called TipRanks Star Ranking System, as explained below: 

Success Rate – An expert’s success rate is measured by the number of times a transaction wins or loses money. 

Average Return – At TipRanks, we consider the average return of all transactions as the best measure of an expert’s performance. By doing so, we rule out the possibility of single lucky hits and focus on the expert’s overall performance. 

Statistical Significance – A higher number of recommendations ensures the expert’s consistency. For this reason, an expert with more recommendations will have his or her ranking scored higher than an expert with fewer recommendation counts (with all other things being even). 

How to Use the Daily Insider Trading Tracker

Tracking an insider’s transactions can be a valuable strategy as insiders often have better practical insights into a company’s outlook than you and me. By following which stocks Insiders are buying or selling, you can see how those most in the know are trading, and thus, make informed investment decisions.  

That is why TipRanks brings you the Daily Insider Trading Tracker, which accumulates the latest insider transactions of companies in its database. The list includes both the informative and uninformative trading calls of C-level Executives, Directors, or 10% Shareholders of a publicly listed company. The list displays the Company Name, the Insider Name, Role, Rank, time frame when the trade was Assigned, Buy/Sell Trade, Amount of Trade, and the link to the original SEC Form. You can navigate to this page by going to Experts – Top-Performing Corporate Insiders – Daily Insider Transactions.  

What’s more, you can even sort the list based on the parameters you wish to see. These include the Role of the insider, nature of the Transaction, the Insider Ranking, the Amount of the trade, Sector, Period, and the Benchmark comparison. Now, go ahead and try following the insider’s trading calls and see how they profit your portfolio.  

How to Use the Insider Profile Pages

A corporate insider usually undertakes stock buying/selling activity based on the best possible information they have about the company. It could be informative to learn about an insider’s historical stock trading success rate and average returns earned. Before deciding to follow a particular insider, it could be worthwhile to study their profile. An insider with a high success rate and high average returns-generating capability could be on your radar to help you form investment decisions about a company.  

On an insider’s profile page, you will find information about their overall Profitable Transactions, meaning how often their transactions have generated positive returns. Plus, you can see the Average Return earned since January 2009. Moreover, you will see a breakdown of all the Insider Holdings and their Most Profitable Insider Trade to date. Also, you can see the different companies in which the individual has a key role and all their trades on those companies’ stocks.  

Moreover, you can see the success rate and average returns earned for the individual company along with the Last Transaction Date, Insider Position, Last Transaction, Last Transaction Amount, and Holding Value. You can choose to follow a specific insider’s trading activities by checking on the +FOLLOW button on the top right corner of the page and receive regular email notifications.  

To navigate to an insider’s profile page, go to Experts – Top-Performing Corporate Insiders, and there you will find a list of all the corporate insiders that TipRanks tracks. Alternatively, if you know the name of the insider that you wish to study, you can type his/her name in the Search Bar on the top left corner of the page and select the insider from the dropdown window. Similarly, you can even navigate to an insider’s profile page by going to a company’s Insider Trading Tool and clicking on the Insider’s Name from the list of insider trades.   

How We Designate Corporate Insiders

TipRanks tracks over 102,000 corporate insiders of publicly traded companies. The types of insiders include:  

  • C-Level executives, such as the CEO, COO, or CFO 
  • Directors 
  • 10% + shareholders 

These insiders are in the best position to gauge the success/failure of the company as they are well-informed about the company’s happenings. Therefore, within their insider transactions hides the most lucrative information of all – private information. The investment rationale suggests that by mimicking the actions of insiders, both sell and buy transactions, one can achieve a higher return than through a simple buy-and-hold strategy. However, due to insider-specific incentives and trading noise, it is important not only to follow all the insiders’ transactions but also to identify which transactions are informative.  

Informative Transactions vs. Uninformative Transactions

While TipRanks consolidates thousands of insider trading activities daily, we go one step further and define these trades as informative versus uninformative. The reason? Informative trades hold more significance from an investor’s trading perspective compared to uninformative trades. While Uninformative Buys and Sells can occur due to myriad reasons, the Informative Buy essentially means the insider sees a bright future for the company, or at least a bright future for his or her own trading account.    

Uninformative transactions indicate that an Insider is buying/selling shares for reasons that do not necessarily indicate confidence in the company. Therefore, they do not hold much significance. For example, an Uninformative Buy in insider trading can be a trade made by an insider who is given shares as a form of compensation. Likewise, Uninformative Sells are often made by Insiders who are exercising options that are about to expire, or cashing in shares that are given to them as a form of payment. 

On the other hand, Informative Buy/Sell transactions are deliberately made by Insiders, thus indicating a vote of confidence in the company. The Informative Buy transaction particularly stands out as a Buy signal for anyone watching. An Informative Buy trade is an instance wherein an insider decides to make a purchase of company shares with his or her own capital. These are significant, as they show an assertion of confidence in the company and its future by the insider and indicate that the stock may gain in price thereafter.   


Analyst Forecast Pages

How to Use the Analyst Forecast Pages in Your Investing Strategy

TipRanks offers an exclusive feature of Analyst Forecasts on stocks. An average investor would find it challenging to build complex financial models for stocks or to forecast a stock’s future price target. TipRanks makes this easier for you by providing both individual and consensus analyst forecasts on stocks. 

A forecast is simply an analyst’s future expectation for the stock, based on thorough research and understanding of the company and the related sector. Following the study, the analyst recommends either Buying/Holding/Selling the stock, and assigns a 12-month price target for the stock. Analyzing these forecasts can prove to be highly beneficial in your stock-picking process, to understand whether or not it is worthwhile to invest in a stock currently.  

The Analyst Forecast page on TipRanks gives you the analyst’s overall/consensus views and price targets on a stock. On this page, you will find the consensus Strong Buy/Moderate Buy/Hold/Moderate Sell/Strong Sell rating for the stock, which is a weighted average calculation based on a 3-point system that incorporates the analyst ratings made over the last 3 months. 

The average 12-month price target is also a combined price target of all analysts tracking the stock in the past three months. What’s more, the price target shows you the related upside/downside potential (%) from the stock’s current price levels. The page also shows you the highest and the lowest price targets assigned by any analyst. You can even select if you want to see All Analysts ratings or only the Top Analysts (those who consistently outperform the market) ratings on a stock. By analyzing these aspects, you can decide if this is the right time for you to take a position in the stock.  

Further below you will find a Detailed List of Analyst Forecasts for the stock along with all the necessary information about both the analyst and their recommendation. As you scroll down, you will find data on the Best Analysts Covering the stock, which includes four Most Accurate Analyst rating the stock, and the four Most Profitable Analysts rating the stock. Finally, at the bottom of the page, you will see TipRanks’ Financial Forecast for a stock. This includes the Earnings Forecast and Sales Forecast for the upcoming quarter, as well as the Analyst Recommendation Trends for a stock. All these datapoints will assist you to make appropriate and timely stock selection.  

How to Use the “Best Analysts Covering” Tool in Your Investing Strategy

Do you know how to find the best analysts covering a particular stock from the thousands of analysts tracking a specific stock? Well, TipRanks makes it easy for you by providing a list of the Most Accurate Analysts and the Most Profitable Analysts for each stock. The Best Analysts Covering tool allows you to follow the analysts who have the best success rates and average returns on a specific stock. Only analysts that have given a Buy or Sell rating on the stock in the past 12 months are eligible for inclusion in this tool. You can find this information right below the Detailed List of Analyst Forecasts on the Forecast page. 

Under both the tabs, you can see the best analyst to follow option if you want to “buy and sell the stock” after different time frames, namely 1 Month, 3 Months, 1 Year, and 2 Years. At a glance, you can see each analyst’s Success Rate for the specified period, and the related Average Return.  

The figures imply that if you had followed the analyst for the specific time frame, you would have generated similar average returns on your investment. After studying the various performances, you can easily know who to trust. You can also choose to follow any analyst from the list and receive real-time alerts of new ratings from the analyst.  

How We Collect and Display Analyst Ratings on Stocks

Studying an analyst’s research report can be a tedious task, and even more so if you are trying to get a gist of their view on a particular stock. At TipRanks, we make this simple for you by collecting and displaying thousands of analyst ratings on a multitude of stocks.  

TipRanks collects Analysts’ Ratings and Price Targets on stocks by scanning publicly available reports on financial websites and by receiving research reports directly from analysts, research firms, or customers.  

The analyst ratings are displayed on the Forecast Page of the stock in the form of a detailed list, as below. Having all this information simplified on a single page, makes it easy for you to assimilate the data and formulate your investment decision wisely.  

  • Analyst Profile including the name and Star Ranking 
  • Name of the Expert Firm of the analyst 
  • The 12-month Price Target on the stock 
  • Analyst’s Position on the stock – Buy/Hold/Sell 
  • Upside/Downside potential (% terms) from the current price levels 
  • Analyst’s Action – Assigned/Reiterated/Initiated/Upgraded/Downgraded 
  • Date when the view was given 
  • Option to Follow the analyst 
  • The Article sourcing the Analyst’s latest opinion on the stock 

What’s more, you can sort the analyst list by clicking on the dropdown menu. There are four options available: Analyst Performance (Star Rating), the Analyst Rating on the stock (Buy/Hold/Sell), Upside/Downside potential (% terms), and the analyst’s Action (Assigned/Reiterated/Initiated/Upgraded/Downgraded). 

How We Designate “Top Analysts”

At TipRanks, you are spoiled for choice with the thousands of analysts we cover and the multitude of stocks in our universe. How can one decide if an analyst is worth following and whether their recommendations are worth considering? TipRanks simplifies this process for you by ranking analysts and sorting the best-performing analysts as Top Analysts.   

TipRanks defines Top Analysts based on a combination of different parameters. These are analysts with the highest overall ranking, highest ranking per sector, highest ranking per time frame, and highest ranking against different benchmarks.   

Notably, Top Analysts often earn a five-star rating from TipRanks. Reaching a 5-star rating is extremely difficult and guarantees the analyst has a High Success Rate accompanied by a High Average Return and High Transaction Count. TipRanks also dedicates a whole section to the top-ranked 25 analysts, which you can further filter by sector to see who you should trust! 

How We Calculate Analyst Consensus on Each Stock

TipRanks provides Analyst Consensus for each stock on its database. Each analyst’s view on a stock is consolidated and an average analyst consensus is calculated as follows: Strong Buy, Moderate Buy, Hold, Moderate Sell, or Strong Sell.  

The consensus is calculated with a 3-point system that incorporates the analyst ratings made over the last 3 months, where: 

Buy = 1 

Hold = 3 

Sell = 5 

The score of every rating made in the last 3 months is calculated to provide one of 5 consensuses: 

Strong Buy: less than or equal to 1.5 

Moderate Buy: more than 1.5, but less than or equal to 2.5 

Hold: more than 2.5, but less than or equal to 3.5 

Moderate Sell: more than 3.5, but less than or equal to 4.5 

Strong Sell: more than 4.5 

Importantly, the consensus rating of the Top Analysts on a stock is based only on those Wall Street analysts whose recommendations were most accurate. The performance measurement incorporates the analysts’ Success Rates and Average Returns and is based on the TipRanks Star Ranking system. 

How We Calculate the Consensus Price Target on Each Stock

Analysts often assign price targets to their buy, hold, and sell recommendations, after undertaking a thorough study of the stock and the sector. TipRanks displays ratings from all analysts listing 12-month Price Targets on a stock in the last 3 months. TipRanks then aggregates all price targets from all analysts recommending a stock and creates a high, average, and low, price target based on a combination of them all. 

The average of these target expectations is the Consensus Price Target, which will reflect either upside or downside potential for the stock. This reveals positive or negative sentiment circling a given stock’s opportunity. Based on the upside/downside potential of the stock, you can decide if this is the right time for you to enter the stock. 

How to Use the “Financial Forecast” for Stocks

At the bottom of the Analyst Forecast page, you will find three charts detailing the Financial Forecast for the stock. In each chart, you will see data for a total of five quarterly figures, with four covering the most recently reported historical quarters and one for the upcoming unreported quarter. By studying the trends in these three charts simultaneously, you can gauge if the stock is poised for underperformance or overperformance, helping you to make an appropriate investment decision.  

The first chart refers to the Earnings Forecast ($ earnings per share) of a stock. For the unreported quarter, you will see three earnings forecasts, namely, the High EPS forecast, the Low EPS forecast, and the Consensus EPS forecast for the next quarter. When you hover over the line graph for the historical quarters, you will see the Actual EPS (the color red means Miss, the color green means Beat), the Consensus EPS, and the EPS Range for the quarter. In the texts beside the Earnings Forecast chart, you will read about how many times the stock has beat its EPS estimates (in % terms) in the past 12 months, as compared to the overall industry beat in the same period. Based on the same, TipRanks will tell you whether the stock has Outperformed or Underperformed its overall industry in the last calendar year.  

Next comes the chart for the Sales Forecast (figure in U.S. dollars) of a stock. For the unreported quarter, you will see three sales forecasts, namely, the High sales forecast, the Low sales forecast, and the Consensus sales forecast for the next quarter. When you hover over the line graph for the historical quarters, you will see the Actual Sales figure (the color red means Miss; the color green means Beat), the Consensus Sales, and the Sales Range for the quarter. In the texts beside the Sales Forecast chart, you will read about how many times the stock has beaten its sales estimates (in % terms) in the past 12 months, as compared to the overall industry beat in the same period. Based on the same, TipRanks will tell you whether the stock has Outperformed or Underperformed its overall industry in the last calendar year.  

Lastly, you will see the chart for the stock’s Analyst Recommendation Trends. The bar graph displays the breakdown of the Buy, Hold, and Sell recommendations of analysts on the stock. By studying the trend of the changes in the recommendations, you can gauge whether a stock is poised for significant upward or downward momentum, or for minimal change. In the texts beside this chart, you will read about the stock’s average analyst price target assigned in the past three months. Also, you will see how many analysts are rating the stock as Buy, Hold, or Sell in the current month. 

The TipRanks Financial Forecast section assists you in analyzing the trend of earnings and sales misses or beats. Plus, knowing the expectations of analysts for the unreported period can help investors understand if the company will be able to outperform expectations or not, and thus whether to make a Buy, Hold or Sell decision on the stock.  

Analyst Rankings

How to Access and Interpret the Analysts’ Ratings on TipRanks

Wall Street analysts popularly rate stocks as a Strong Buy, Moderate Buy, Hold, Moderate Sell, or Strong Sell, after thoroughly studying a company and the sector that it caters to. The analyst ratings can be accessed from each individual company’s forecast page. Along with stock recommendations, the analysts assign a 12-month price target that will imply if a stock’s price is likely to go up or down from the current price levels, in turn implying the percentage gain or loss on a stock if we buy/hold/sell now.  

A Strong Buy rating means analysts expect the stock will far exceed the average return on the stock market. Thus, that implies an upward trend in the price performance.   

A Moderate Buy means analysts expect that the stock will outperform the overall stock market, with a related increase in the stock’s price.  

A Hold means analysts recommend neither buying nor selling the stock (if you already own it). A Hold rating is usually given due to strong volatility in the stock market, the performance of other stocks in the same sector, or uncertainty about the stock. 

A Moderate Sell means analysts expect the stock to perform slightly lower than the overall stock market, implying a downtrend in the stock’s price.  

A Strong Sell means analysts expect the stock to perform much lower than the overall stock market, along with a related fall in its price.  

How to Compare the Performance of Different Analysts – Top Wall Street Analysts page

Before deciding to follow the stock recommendations of a particular analyst it is advisable to study the analyst’s historical performance. At TipRanks, we consolidate the past performance of analysts and rank them based on the average returns earned per transaction, and their success rate of giving the right calls on stocks. To study that, visit the Top Analysts page on TipRanks. Navigate to the page from the top menu, by clicking on Experts – Top Analysts.  

On the Top Analysts page, you will find a list of all analysts in the TipRanks universe, ranked based on the proprietary TipRanks Star Ranking System. The list will give you the Analyst Names, the Research Firms they work for, the Sectors they specialize in, their Buy/Hold/Sell rating Distributions, Success Rates, Average Returns earned, and Followers. You can sort the list as per the parameter you want, by simply clicking on the tab.  

A high rating for an analyst signifies that he/she has a proven track record of generating attractive returns on stock picks. Depending on your investment strategy, you can choose to follow an analyst based on parameters such as the success rate, average return, or the sector. If you are not keen on a specific sector exposure, the highest success rate and average returns would be a good point to start with.  

On the other hand, if you are interested in investing in a specific sector, select an analyst with the highest ranking in that sector. This way you are sure of following one of the best sectoral experts, thus increasing the probability of making successful investments.  

Once you have selected the analyst to follow, you can click on the analyst’s name to further study their performance. The analyst page will give you a list of stocks for which the analyst has given recommendations, along with the average return and success rate generated for each stock. Additionally, you can study the analyst’s returns and success rate compared to the benchmark index. You can choose to follow an analyst by clicking on the “+Follow” button on the consolidated list or from each analyst’s page. By doing so, you will receive regular email alerts each time the analyst gives a new rating on a stock. 

How We Rank the Experts – The TipRanks Star Ranking

We developed a 3-tier unique proprietary formula called the TipRanks Star Ranking System to rank all experts in our universe. The three factors considered are the experts’ success rates, the average return per transaction, and statistical significance. We use the formula to rank all experts including Wall Street Analysts, Financial Bloggers, Research Firms, Corporate Insiders, Hedge Fund Managers, and Individual Investors.  

Success Rate – An expert’s success rate is measured by the number of times a transaction wins or loses money. Success is defined as a binary – win or lose – as the transaction either makes a profit or loss after a defined period. The default period is one year, or until the expert changes their recommendation. The average is the win-to-loss ratio. We add this to ensure that an expert does not have 10 losing transactions offset by one winning transaction with a high profit – making his or her performance unreasonably high. This measure is often referred to as the hit ratio. 

Average Return – At TipRanks, we consider the average return of all transactions as the best measure of an expert’s performance. By doing so, we rule out the possibility of single lucky hits and focus on the expert’s overall performance. For each rating or transaction an expert makes, we measure their return over a defined period. The default period is one year, or until the expert changes their recommendation. We then present the expert’s average return per transaction. 

Statistical Significance – A higher number of recommendations ensures the expert’s consistency. For this reason, an expert with more recommendations will have his or her ranking scored higher than an expert with fewer recommendation counts (with all other things being even). In the same way, an expert with a 1,000% average return but one recommendation would rank very low, while an expert with just a 2% average return across hundreds of recommendations would rank very high. 

How We Measure Analyst Success Rates and Average Returns

If you have decided to follow a particular analyst’s recommendations, it will be worthwhile to study how the analyst fares compared to his/her peers. TipRanks makes this easy for you by ranking analysts as per the proprietary TipRanks Star Ranking System.  

Success Rate – An analyst’s success rate is measured by the number of times a transaction wins or loses money. Success is defined as a binary – win or lose – as the transaction either makes a profit or loss after a defined period. The default period is one year, or until the analyst changes their recommendation. The average is the win-to-loss ratio. We add this to ensure that an analyst does not have 10 losing transactions offset by one winning transaction with a high profit – making his or her performance unreasonably high. This measure is often referred to as the hit ratio. 

Average Return – At TipRanks, we consider the average return of all transactions as the best measure of an analyst’s performance. By doing so, we rule out the possibility of single lucky hits and focus on the analyst’s overall performance. For instance, analysts in the biotech field will naturally have higher returns on their winning trades, but those will still have to compensate for higher losses on bad recommendations. 

How the Benchmark Affects Analyst Rankings

While studying an analyst’s performance, it is always advisable to compare the analyst’s returns to those generated by a benchmark. A benchmark can be any of the leading indices, namely the Nasdaq 100 (NDX), S&P 500 (SPX), or the Dow Jones Industrial Average (DJIA). A suitable benchmark can also be the overall performance of stocks in a particular sector in which the analyst specializes. Comparing the performance with a benchmark can considerably change the analyst’s average return and success rate figures.  

For instance, the charts below show the success rate of five-star analyst Mark Lipacis from Jefferies. The three charts display the varying success rates and average returns on a stand-alone basis, compared to the SPX, and compared to the Technology sector. The Time Frame considered can also change the success rates and average returns per transaction. You can select from among the 1 Month, 3 Months, 1 Year, and 2 Years time frames, with the default being 1 Year.  


TipRanks – What We Do 

Are you looking for some new and unique tools to help smooth out your investment journey? Look no more, TipRanks is one of the fastest-growing stock analysis and fundamental research platforms, helping investors make better, data-driven investment decisions. TipRanks offers a plethora of proprietary tools to boost your research capabilities. The tools that were once available only to professional, high-net-worth institutional investors, are now easily available to retail investors on TipRanks.    

TipRanks’ tools are highly valued in the investment community and provide a variety of alternative datasets to improve your investment choices. Through TipRanks, you can have the power of a multitude of research tools at your fingertips. Start using the TipRanks portal today, either on the desktop or on your smartphone, and reap the benefits of our unique tools. 

What is the Difference Between TipRanks’ Premium and Ultimate Plans, and Which Should I Buy?

Now that you are aware of the many benefits that TipRanks’ tools offer an investor, it’s time to dive into the details of our subscription plans. TipRanks has two paid subscription plans for users: the Premium and Ultimate plans. As an Ultimate Plan subscriber, more features will be unlocked to facilitate your research journey. To see the features included in each plan, go to the Plans & Pricing tab on the main menu. The gist of the main features of both plans is described below.  

TipRanks Premium Plan – Includes all features including Premium Stock Analysis, which allows you to research any stock with the help of TipRanks’ unique data sets. You can get New Investment Ideas through the Big Data-based ideas using the Top Smart Score stocks, Analyst and Insider stock breakdowns. Moreover, you get access to Smart Portfolio Research tools that include Top Analysts’ Price Targets and Consensus, Hedge Funds, Insider signals, etc. Also, subscribers gain access to all Premium Research Tools including stock screeners and earnings calendar, receive Daily Expert Insights of real-time stock recommendations and transactions, and get Premium Expert Access to the views of Wall Street analysts, Hedge fund managers, Corporate Insiders, and Bloggers. Plus, you get to personalize your email alerts or Follow 30 Stocks of your choice and have the option for PDF Export of data as well as Priority Support.   

TipRanks Ultimate Plan – includes all features of TipRanks Premium, along with access to a larger set of TipRanks’ unique tools. These include Stock Risk Factor Analysis, which displays the potential risks the stock is exposed to through the reports available at the SEC. Get a list of daily Insiders’ Hot Stocks that exhibit Strong Buy indicators based on corporate insiders’ trading activities. Plus, you get access to Popular Websites Screener, which lists companies with the most trending website traffic trends and get Research Firm Rankings to choose which analysts should be followed based on the popularity of the firms they work for. Furthermore, get a list of Complete Expert Rankings to scan the best-performing experts over longer or shorter time periods, as well as compare an expert’s performance against the performance of its overall Sector or against the S&P 500 (SPX) index. What’s more, you can avail yourself of email alerts for an Unlimited number of stocks, and you get both PDF+CSV download options and VIP support for troubleshooting.   

Now that you are well versed with the different features of both plans, you can choose between them depending on your investment objective. Premium is our most popular plan, as it gives you access to many tools and data you need to make data-driven investment decisions. That being said, Ultimate is becoming increasingly popular with investors who enjoy full access to all of TipRanks’ tools. Additionally, you can take advantage of our 30-day money back guarantee when you buy or upgrade to a yearly plan. 

TipRanks – Customized for You

How to Create an Account on TipRanks

To start your investment journey on TipRanks and to avail yourself of the full benefits of all features, start with signing up for the TipRanks platform. On the top right of the TipRanks page, you will see the Login/Join button. For a first-time user, click on the Join button that will take you to the Sign-Up page. Here, you have three options: Sign Up with an existing Google account; Sign Up with an existing Facebook account; OR Sign Up with another personal email account. If you would like to use your Google or Facebook account to sign in, you can do so by inputting the respective passwords and successfully logging in to TipRanks.

To create a login with a personal account, first, add your email ID, and then you need to check the I’m not a robot option. This will show you a small pop-up window that will ask you to verify some images. Once you are verified, you need to go through the terms and conditions page of using the TipRanks portal and then check the box which reads, “I agree to TipRanks’ Terms of Use and Privacy Policy.”

After this step, click the CONFIRM button, which brings you to select a password for your new TipRanks account. After you add a password, click on JOIN, which will send a confirmation email to the email address that you are using for signing in. When you open your email, you will see a confirmation email to click on, and voila, you have become a member of the TipRanks Community. After this step, you can go back to the TipRanks main page and LOGIN with your email account and password.

Haven’t created a TipRanks account yet? Click here to join the growing TipRanks community TipRanks | Stock Market Research, News and Analyst Forecasts – TipRanks.com 

The link has been copied!